IBM 2006 Annual Report Download - page 113
Download and view the complete annual report
Please find page 113 of the 2006 IBM annual report below. You can navigate through the pages in the report by either clicking on the pages listed below, or by using the keyword search tool below to find specific information within the annual report.-
 1
1 -
2
-
3
-
4
-
5
-
6
-
7
-
8
-
9
-
10
-
11
-
12
-
13
-
14
-
15
-
16
-
17
-
18
-
19
-
20
-
21
-
22
-
23
-
24
-
25
-
26
-
27
-
28
-
29
-
30
-
31
-
32
-
33
-
34
-
35
-
36
-
37
-
38
-
39
-
40
-
41
-
42
-
43
-
44
-
45
-
46
-
47
-
48
-
49
-
50
-
51
-
52
-
53
-
54
-
55
-
56
-
57
-
58
-
59
-
60
-
61
-
62
-
63
-
64
-
65
-
66
-
67
-
68
-
69
-
70
-
71
-
72
-
73
-
74
-
75
-
76
-
77
-
78
-
79
-
80
-
81
-
82
-
83
-
84
-
85
-
86
-
87
-
88
-
89
-
90
-
91
-
92
-
93
-
94
-
95
-
96
-
97
-
98
-
99
-
100
-
101
-
102
-
 103
103 -
 104
104 -
 105
105 -
 106
106 -
 107
107 -
 108
108 -
 109
109 -
 110
110 -
 111
111 -
 112
112 -
 113
113 -
 114
114 -
 115
115 -
 116
116 -
 117
117 -
 118
118 -
 119
119 -
 120
120 -
 121
121 -
 122
122 -
 123
123 -
124
 |
 |

Black
MAC
390 CG10
NOTES TO CONSOLIDATED FINANCIAL STATEMENTS
INTERNATIONAL BUSINESS MACHINES CORPORATION AND SUBSIDIARY COMPANIES
111
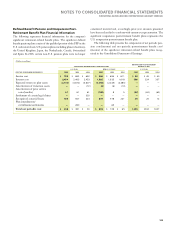
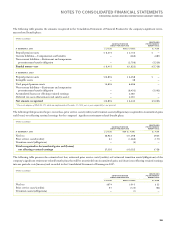
(Dollars in millions)
2006 2005
BENEFIT BENEFIT
AT DECEMBER 31: OBLIGATION PLAN ASSETS OBLIGATION PLAN ASSETS
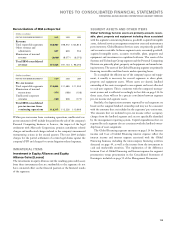
Plans with PBO in excess of plan assets $, $ , $, $,
Plans with ABO in excess of plan assets , , , ,
Plans with assets in excess of PBO , , , ,
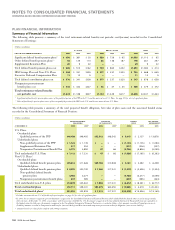
W. SEGMENT INFORMATION
The company uses business insight and its broad range of IT
capabilities to create client- and industry-specific information
solutions. The company operates primarily in a single industry using
several segments that create value by offering solutions that include,
either singularly or in some combination, services, software, hardware
and financing.
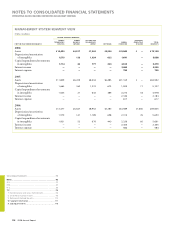
Organizationally, the company’s major operations comprise a
Global Technology Services segment; a Global Business Services
segment; a Software segment; a predominantly hardware product seg-
ment—Systems and Technology Group; and a Global Financing
segment. The segments represent components of the company for
which separate financial information is available that is utilized on a
regular basis by the chief executive officer in determining how to
allocate the company’s resources and evaluate performance. The seg-
ments are determined based on several factors, including client base,
homogeneity of products, technology, delivery channels and similar
economic characteristics.
Information about each segment’s business and the products and
services that generate each segment’s revenue is located in the
“Description of Business” section of the Management Discussion on
page 19, and “Segment Details,” on pages 29 to 32.
In 2004, the company combined the Systems Group segment and
the Technology Group segment and formed the Systems and Technol-
ogy Group segment.
In the second quarter of 2005, the company sold its Personal
Computing business which was previously a part of the Personal
Systems Group. The two remaining units of the Personal Systems
Group, Retail Store Solutions and Printing Systems, were combined
with the Systems and Technology Group. Personal Computing
Division financial results are displayed as part of the segment disclo-
sures, in a manner consistent with the segment disclosures.
In the first quarter of 2006, the company made changes to its
management system. This included the transfer of products and ser-
vices from the former Enterprise Investments segment to other
reportable segments and the separation of the prior Global Services
segment into the two new reportable segments: Global Technology
Services and Global Business Services. In addition to the creation of
two new reportable segments, there are two primary differences to
previously reported information. First, the Business Transformation
Outsourcing (BTO) business was aligned within the Global
Technology Services segment. This brought the company’s outsourc-
ing businesses together, and drives synergies within the company’s
offerings and delivery capabilities. U.S. Federal BTO remained with
the U.S. Federal business within Global Business Services, to con-
tinue to leverage the synergy in the company’s Federal offerings and
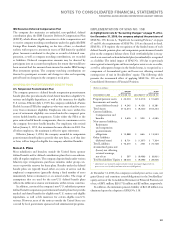
delivery capabilities. Secondly, the Application Management Services
(AMS) business was consolidated under the Global Business Services
segment. As a result, the AMS business for custom and legacy applica-
tions previously reported in Strategic Outsourcing revenue is now
included in Global Business Services.
Previously reported segment information has been restated for
all periods presented to reflect those changes in the company’s
reportable segments.
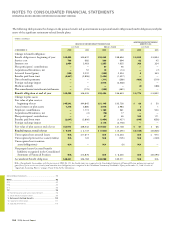
Segment revenue and pre-tax income include transactions between
the segments that are intended to reflect an arm’s-length transfer
price. Hardware and software that is used by the Global Technology
Services segment in outsourcing engagements is primarily sourced
internally from the Systems and Technology Group and Software seg-
ments. For the internal use of IT services, the Global Technology
Services segment and the Global Business Services segment recover
cost, as well as a reasonable fee, reflecting the arm’s-length value of
providing the services. The Global Services segments enter into
arm’s-length leases and loans at prices equivalent to market rates with
the Global Financing segment to facilitate the acquisition of equip-
ment used in services engagements. All internal transaction prices are
reviewed annually, and reset if appropriate.
The company uses shared resources concepts to realize economies
of scale and efficient use of resources. As a result, a considerable
amount of expense is shared by all of the company’s segments. This
expense represents sales coverage, marketing and support functions
such as Accounting, Treasury, Procurement, Legal, Human Resources
and Billing and Collections. Where practical, shared expenses are
allocated based on measurable drivers of expense, e.g., headcount.
When a clear and measurable driver cannot be identified, shared
expenses are allocated on a financial basis that is consistent with the
company’s management system; e.g., advertising is allocated based on
the gross profits of the segments. The unallocated corporate amounts
arising from certain divestitures, indirect infrastructure reductions,
miscellaneous tax items and the unallocated corporate expense pool
are recorded in net income but are not allocated to the segments.