IBM 2006 Annual Report Download - page 34
Download and view the complete annual report
Please find page 34 of the 2006 IBM annual report below. You can navigate through the pages in the report by either clicking on the pages listed below, or by using the keyword search tool below to find specific information within the annual report.-
 1
1 -
2
-
3
-
4
-
5
-
6
-
7
-
8
-
9
-
10
-
11
-
12
-
13
-
14
-
15
-
16
-
17
-
18
-
19
-
20
-
21
-
22
-
23
-
 24
24 -
 25
25 -
 26
26 -
 27
27 -
 28
28 -
 29
29 -
 30
30 -
 31
31 -
 32
32 -
 33
33 -
 34
34 -
 35
35 -
 36
36 -
 37
37 -
 38
38 -
 39
39 -
 40
40 -
 41
41 -
 42
42 -
 43
43 -
 44
44 -
45
-
46
-
47
-
48
-
49
-
50
-
51
-
52
-
53
-
54
-
55
-
56
-
57
-
58
-
59
-
60
-
61
-
62
-
63
-
64
-
65
-
66
-
67
-
68
-
69
-
70
-
71
-
72
-
73
-
74
-
75
-
76
-
77
-
78
-
79
-
80
-
81
-
82
-
83
-
84
-
85
-
86
-
87
-
88
-
89
-
90
-
91
-
92
-
93
-
94
-
95
-
96
-
97
-
98
-
99
-
100
-
101
-
102
-
103
-
104
-
105
-
106
-
107
-
108
-
109
-
110
-
111
-
112
-
113
-
114
-
115
-
116
-
117
-
118
-
119
-
120
-
121
-
122
-
123
-
124
 |
 |

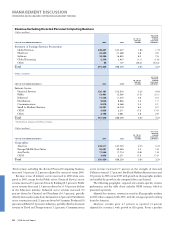
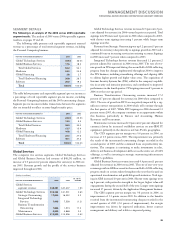
Revenue from the WebSphere family of products increased 23.3
percent (22 percent adjusted for currency) and was led by double-
digit growth in WebSphere Application Servers (25.3 percent) and
WebSphere Business Integration (22.7 percent) software versus 2005.
WebSphere provides the foundation for Web-enabled applications
and is a key product set in deploying SOA.
Information Management software helps companies integrate,
manage and gain value from their business information. For the year,
revenue increased 14.0 percent (13 percent adjusted for currency).
Growth was driven by the company’s “Information on Demand” port-
folio of software products. The acquisition of FileNet Corporation,
during the fourth quarter of 2006, also contributed to the growth
when compared to the year-ago period.
Lotus revenue increased 12.0 percent (11 percent adjusted for cur-
rency) driven by the Notes/Domino family of collaboration products.
The company’s Lotus products provide clients with collaborative
solutions which enable the integration of people, data and business
processes as part of the company’s On Demand and SOA offerings.
Customer loyalty to Lotus products remains strong.
Tivoli revenue increased 26.3 percent (25 percent adjusted for
currency) with double-digit growth in each of its key segments:
Systems Management (24.5 percent), Security (40.8 percent) and
Storage (27.4 percent). The acquisitions of Micromuse, Inc. in the
first quarter and MRO Software, Inc. in the fourth quarter added to
the company’s capabilities in the Tivoli brand and contributed to the
revenue growth.
Rational revenue increased 4.4 percent (3 percent adjusted for
currency) in 2006 versus 2005, in a slower growing market. Rational
software provides customers with products that manage the business
process of software and systems delivery.
Revenue from Other middleware products declined 0.6 percent
(1 percent adjusted for currency) in 2006. This product set includes
more mature products which provide a more stable flow of revenue.
Operating Systems revenue declined 6.3 percent ( 7 percent
adjusted for currency) in 2006 versus 2005. Operating Systems are
closely tied to the company’s server products. The decline in revenue
was primarily driven by improved price performance in System z
operating systems.
Product Lifecycle Management (PLM) revenue increased 4.2
percent (4 percent adjusted for currency) in 2006 versus 2005. This
product set benefited from a number of large transactions in the sec-
ond quarter of 2006.
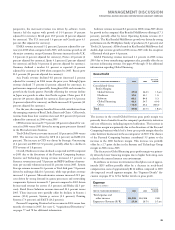
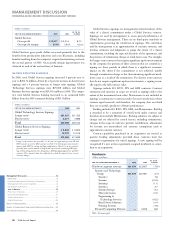
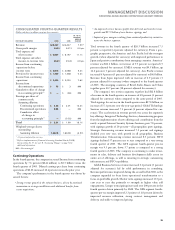
(Dollars in millions)
YR. TO YR.
FOR THE YEAR ENDED DECEMBER 31: 2006 2005 CHANGE
Software:
Gross profit $, $, .%
Gross profit margin .% .% . pts.
The increase in Software gross profit dollars and gross profit margin
was primarily driven by the 7.9 percent growth in Software revenue.
The Software segment contributed $5.5 billion of pre-tax profit in
2006, an increase of 14.9 percent versus 2005. Pre-tax profit margins
improved 1.5 points to 26.9%.
Global Financing
See pages 49 and 50 for a discussion of Global Financing’s revenue
and gross profit.
FINANCIAL POSITION
Dynamics
The assets and debt associated with the company’s Global Financing
business are a significant part of the company’s financial position. The
financial position amounts appearing below and on pages 33 and 34
are the company’s consolidated amounts including Global Financing.
However, to the extent the Global Financing business is a major driver
of the consolidated financial position, this narrative section will refer
to the separate Global Financing section in this Management Discussion
on pages 49 through 53. The amounts appearing in the separate Global
Financing section are supplementary data presented to facilitate an
understanding of the company’s Global Financing business.
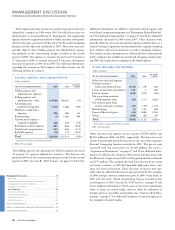
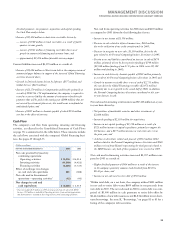
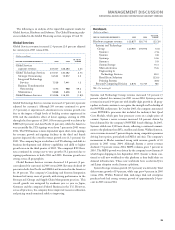
Working Capital
(Dollars in millions)
AT DECEMBER 31: 2006 2005
Current assets $, $,
Current liabilities , ,
Working capital $ , $,
Current ratio . .
Working capital decreased $5,940 million compared to the prior year
primarily as a result of an increase in Current liabilities. The key drivers
are described below:
Current assets decreased $1,001 million due to:
• Decline of $3,030 million, net of a favorable $202 million currency
impact, in Cash and cash equivalents and Marketable Securities due
to current-year requirements in pension funding, share repurchase,
MANAGEMENT DISCUSSION
INTERNATIONAL BUSINESS MACHINES CORPORATION AND SUBSIDIARY COMPANIES
32 2006 Annual Report
Management Discussion ........................................................
Road Map .............................................................................
Forward-Looking and Cautionary Statements .....................
Management Discussion Snapshot ......................................
Description of Business .......................................................
Year in Review......................................................................
Prior Year in Review .............................................................
Discontinued Operations .....................................................
Other Information ................................................................
Global Financing ..................................................................
Report of Management .........................................................
Report of Independent Registered Public Accounting Firm ....
Consolidated Statements .......................................................
Black
MAC
2718 CG10