IBM 2006 Annual Report Download - page 40
Download and view the complete annual report
Please find page 40 of the 2006 IBM annual report below. You can navigate through the pages in the report by either clicking on the pages listed below, or by using the keyword search tool below to find specific information within the annual report.-
 1
1 -
2
-
3
-
4
-
5
-
6
-
7
-
8
-
9
-
10
-
11
-
12
-
13
-
14
-
15
-
16
-
17
-
18
-
19
-
20
-
21
-
22
-
23
-
24
-
25
-
26
-
27
-
28
-
29
-
 30
30 -
 31
31 -
 32
32 -
 33
33 -
 34
34 -
 35
35 -
 36
36 -
 37
37 -
 38
38 -
 39
39 -
 40
40 -
 41
41 -
 42
42 -
 43
43 -
 44
44 -
 45
45 -
 46
46 -
 47
47 -
 48
48 -
 49
49 -
 50
50 -
51
-
52
-
53
-
54
-
55
-
56
-
57
-
58
-
59
-
60
-
61
-
62
-
63
-
64
-
65
-
66
-
67
-
68
-
69
-
70
-
71
-
72
-
73
-
74
-
75
-
76
-
77
-
78
-
79
-
80
-
81
-
82
-
83
-
84
-
85
-
86
-
87
-
88
-
89
-
90
-
91
-
92
-
93
-
94
-
95
-
96
-
97
-
98
-
99
-
100
-
101
-
102
-
103
-
104
-
105
-
106
-
107
-
108
-
109
-
110
-
111
-
112
-
113
-
114
-
115
-
116
-
117
-
118
-
119
-
120
-
121
-
122
-
123
-
124
 |
 |

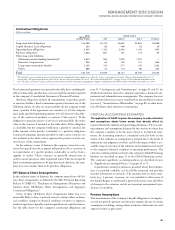
• Change of the company’s operating model in Europe—shifting
resources and decision-making closer to the clients;
• Redesign of the company’s U.S. pension plan, as well as taking actions
in other countries; over the longer term, these actions will reduce
volatility and provide a more competitive cost structure;
• Repatriation of $9.5 billion of foreign earnings under the American
Jobs Creation Act of 2004 improving the company’s geographic
liquidity position; and
• Further extension of the company’s commitment to innovation and
open standards.
On April 30, 2005, the company sold its Personal Computing busi-
ness. Accordingly, the company’s reported revenue results include
four months of revenue for the Personal Computing Division in 2005
versus 12 months in 2004. A significant driver of the changes in rev-
enue, on an as-reported basis, is the incomparable periods for which
the Personal Computing business results are included in the as-
reported results.
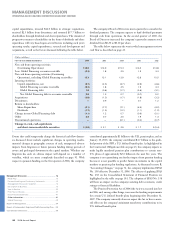
As-reported revenue across all industry sectors declined, except for
the Distribution sector, which was essentially flat, due to the sale of
the Personal Computing business. The Financial Services revenue
decrease (1.7 percent) was driven by Financial Markets (12.2 percent)
partially offset by increases in Insurance (1.9 percent) and Banking
(0.5 percent). The Public sector revenue decline ( 5.1 percent) was
driven by Education ( 31.0 percent), Life Sciences (19.1 percent) and
Government (2.0 percent), partially offset by increased revenue in
Healthcare (13.1 percent). The Distribution sector revenue increase
(0.1 percent) was driven by Travel and Transportation (11.0 percent)
and Consumer Products (2.6 percent), partially offset by lower reve-
nue in Retail industry (7.5 percent). The decrease (3.4 percent) in
Communications sector revenue was driven by Media and
Entertainment (11.5 percent), Utilities ( 5.4 percent) and Telecommu-
nications (1.1 percent). Revenue from Small & Medium Business
declined 13.6 percent.
Americas’ revenue declined 3.1 percent (4 percent adjusted for
currency) and was driven by the sale of the Personal Computing busi-
ness. The U.S. declined 5 percent, while Canada increased 5 percent
(declined 3 percent adjusted for currency) and Latin America increased
8 percent (declined 2 percent adjusted for currency).
Revenue in EMEA declined ( 5.1 percent as reported and 4 per-
cent adjusted for currency) across most major countries driven by the
sale of the Personal Computing business. Of the major countries,
Germany declined 12 percent (11 percent adjusted for currency),
France declined 7 percent (6 percent adjusted for currency), Italy
declined 11 percent (10 percent adjusted for currency), the U.K.
declined 1 percent (flat adjusted for currency) and Spain declined 1
percent (flat adjusted for currency).
Asia Pacific had the weakest results (decreased 12.5 percent as
reported and 13 percent adjusted for currency) of the major geogra-
phies in 2005. Japan, which represents about 60 percent of the Asia
Pacific revenue base, declined 13 percent (11 percent adjusted for
currency) in 2005 versus 2004. In addition, ASEAN (Association of
Southeast Asian Nations) revenue declined 3 percent ( 3 percent
adjusted for currency) and China declined 19 percent (20 percent
adjusted for currency), while India revenue increased 10 percent (8
percent adjusted for currency).
The company continued to invest in growth initiatives in its
emerging countries. Revenue growth in these emerging countries was
driven by client investment to build out their infrastructures, especially
in the Financial Services sector. Overall revenue in these countries
declined 2 percent (9 percent adjusted for currency). The declines
were driven by the sale of the Personal Computing business. China
declined 19 percent (20 percent adjusted for currency), while Brazil’s
revenue grew 21 percent (1 percent adjusted for currency), India’s
revenue grew 10 percent (8 percent adjusted for currency) and Russia’s
revenue increased 2 percent (2 percent adjusted for currency).
OEM revenue increased 13.4 percent primarily due to improved
manufacturing yields for game processors driven by the ramp up of
production for these processors in the second half of 2005. In addi-
tion, E&TS revenue continued to show strong revenue growth.
The company believes that a more appropriate discussion is one
that excludes the revenue results of the Personal Computing business
in both 2005 and 2004 because it presents results on a comparable
basis and provides a more meaningful discussion which focuses on the
company’s ongoing operational performance.
Revenue across all Industry sectors increased, except for the
Industrial sector, when excluding revenue from the Personal
Computing business. Revenue growth was lead by Small & Medium
Business (6.5 percent) followed by the Public sector (5.4 percent),
Distribution sector (5.0 percent), Financial Services (1.7 percent) and
Communications (0.8 percent). Revenue from the Industrial sector
declined 2.3 percent.
Revenue in all geographies increased in 2005 versus 2004, with the
exception of Asia Pacific. Americas’ revenue increased 5.1 percent
(4 percent adjusted for currency) with growth across all key brands
and regions. Revenue in EMEA increased 2.3 percent (4 percent
adjusted for currency) with mixed performance across the major
countries. Asia Pacific revenue decreased 0.9 percent (1 percent
adjusted for currency). Overall revenue in the emerging countries of
Brazil, India, Russia and China increased a combined 23 percent (14
percent adjusted for currency) in 2005 versus 2004.
MANAGEMENT DISCUSSION
INTERNATIONAL BUSINESS MACHIN ES CORPORATION AND SUBSI DIARY COMPANIES
38 2006 Annual Report
Management Discussion ........................................................
Road Map .............................................................................
Forward-Looking and Cautionary Statements .....................
Management Discussion Snapshot ......................................
Description of Business .......................................................
Year in Review......................................................................
Prior Year in Review .............................................................
Discontinued Operations .....................................................
Other Information ................................................................
Global Financing ..................................................................
Report of Management .........................................................
Report of Independent Registered Public Accounting Firm ....
Consolidated Statements .......................................................
Black
MAC
2718 CG10