IBM 2006 Annual Report Download - page 37
Download and view the complete annual report
Please find page 37 of the 2006 IBM annual report below. You can navigate through the pages in the report by either clicking on the pages listed below, or by using the keyword search tool below to find specific information within the annual report.-
 1
1 -
2
-
3
-
4
-
5
-
6
-
7
-
8
-
9
-
10
-
11
-
12
-
13
-
14
-
15
-
16
-
17
-
18
-
19
-
20
-
21
-
22
-
23
-
24
-
25
-
26
-
 27
27 -
 28
28 -
 29
29 -
 30
30 -
 31
31 -
 32
32 -
 33
33 -
 34
34 -
 35
35 -
 36
36 -
 37
37 -
 38
38 -
 39
39 -
 40
40 -
 41
41 -
 42
42 -
 43
43 -
 44
44 -
 45
45 -
 46
46 -
 47
47 -
48
-
49
-
50
-
51
-
52
-
53
-
54
-
55
-
56
-
57
-
58
-
59
-
60
-
61
-
62
-
63
-
64
-
65
-
66
-
67
-
68
-
69
-
70
-
71
-
72
-
73
-
74
-
75
-
76
-
77
-
78
-
79
-
80
-
81
-
82
-
83
-
84
-
85
-
86
-
87
-
88
-
89
-
90
-
91
-
92
-
93
-
94
-
95
-
96
-
97
-
98
-
99
-
100
-
101
-
102
-
103
-
104
-
105
-
106
-
107
-
108
-
109
-
110
-
111
-
112
-
113
-
114
-
115
-
116
-
117
-
118
-
119
-
120
-
121
-
122
-
123
-
124
 |
 |

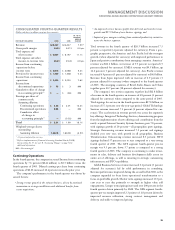
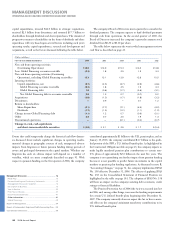
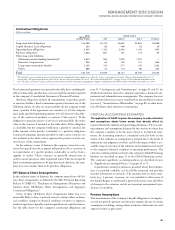
CONSOLIDATED FOURTH-QUARTER RESULTS
(Dollars and shares in millions except per share amounts)
YR. TO YR.
PERCENT/
MARGIN
FOR FOURTH QUARTER: 2006 2005 CHANGE
Revenue $, $, .%*
Gross profit margin .% .% . pts.
Total expense and
other income $ , $ , .%
Total expense and other
income-to-revenue ratio .% .% . pts.
Income from continuing
operations before
income taxes $ , $ , .%
Provision for income taxes $ , $ , .%
Income from continuing
operations $ , $ , .%
Income from
discontinued operations $ $ NM
Cumulative effect of change
in accounting principle** $ — $ () NM
Earnings per share of
common stock:
Assuming dilution:
Continuing operations $ . $ . .%
Discontinued operations . — NM
Cumulative effect
of change in
accounting principle** — (.) NM
Total $ . $ . .%
Weighted-average shares
outstanding:
Assuming dilution ,. ,. (.)%
* 4.1 percent adjusted for currency.
** Reflects implementation of Financial Accounting Standards Board (FASB)
Interpretation No. 47. See note B, “Accounting Changes,” on page 72 for
additional information.
NM—Not meaningful
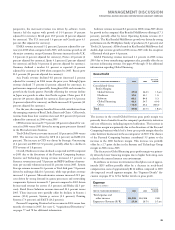
Continuing Operations
In the fourth quarter, the company increased Income from continuing
operations by 7.6 percent ($244 million) to $3.5 billion versus the
fourth quarter of 2005. Diluted earnings per share from continuing
operations of $2.26 increased 12.4 percent versus the prior year.
The company’s performance in the fourth quarter was driven by
several factors:
• Strong revenue growth in the software business, driven by continued
momentum in strategic middleware and additional benefits from
recent acquisitions;
• An improved services business profile that delivered accelerated revenue
growth and $17.8 billion of new business signings; and
• Improved gross margins resulting from continued productivity initiatives
across the business segments.
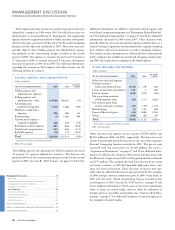
Total revenue in the fourth quarter of $26.3 billion increased 7.5
percent as reported (4 percent adjusted for currency). From a geo-
graphic perspective, the Americas and Asia Pacific had the strongest
growth, (when adjusted for currency) with improved performance in
Japan and positive contributions from emerging countries. Americas’
revenue was $11.1 billion, an increase of 5.9 percent as reported (5
percent adjusted for currency). EMEA revenue was $9.3 billion, up
11.2 percent ( 3 percent adjusted for currency). Asia Pacific revenue
increased 6.9 percent (5 percent adjusted for currency) to $4.8 billion.
Revenue from Japan improved with an increase of 2.9 percent (3
percent adjusted for currency) when compared to the fourth quarter
of 2005. The emerging countries of Brazil, India, Russia and China
together grew 20.7 percent (18 percent adjusted for currency).
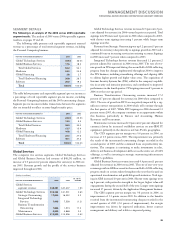
The company’s two services segments together had $12.8 billion
of revenue in the fourth quarter, an increase of 6.8 percent (3 percent
adjusted for currency) when compared to the same period of 2005.
Total signings for services in the fourth quarter were $17.8 billion, an
increase of 55.1 percent over the year-ago period. Global Technology
Services revenue increased 7.1 percent (4 percent adjusted for cur-
rency). The acceleration in revenue growth was across the segment’s
key offerings. Integrated Technology Services, demonstrating progress
from the implementation of new offerings and contribution from the
newly acquired Internet Security Systems business grew 7.8 percent,
with signings growth of 20 percent—all geographies grew signings.
Strategic Outsourcing revenue increased 7.2 percent and signings
doubled year over year, with growth in all geographies. Business
Transformation Outsourcing revenue increased 8.5 percent. BTO
signings declined 57 percent year to year compared to a very strong
fourth quarter of 2005. The GTS segment fourth-quarter pre-tax
margin was 9.3 percent, down 3.7 points as compared to a strong
fourth quarter of 2005. The company is continuing to make invest-
ments in sales, delivery and business development skills across its
entire set of offerings, as well as investing in strategic outsourcing
infrastructure and BTO capabilities.
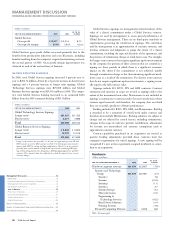
Global Business Services revenue increased 6.1 percent (3 percent
adjusted for currency) led by solid performance in consulting.
Revenue performance improved during the second half of 2006, as the
company expanded its focus from operational transformation to a
focus on profitable growth. Shorter term signings increased 13.5 per-
cent year to year due primarily to strength in higher value add
engagements. Longer term signings increased over 200 percent in the
fourth quarter driven primarily by AMS. The GBS segment fourth-
quarter pre-tax margin improved 2.3 points to 11.8 percent driven by
improved resource utilization, strong contract management and
delivery, and stable-to-improved pricing.
MANAGEMENT DISCUSSION
INTERNATIONAL BUSINESS MACHINES CORPORATION AND SUBSIDIARY COMPANIES
35
Black
MAC
2718 CG10