IBM 2006 Annual Report Download - page 25
Download and view the complete annual report
Please find page 25 of the 2006 IBM annual report below. You can navigate through the pages in the report by either clicking on the pages listed below, or by using the keyword search tool below to find specific information within the annual report.-
 1
1 -
2
-
3
-
4
-
5
-
6
-
7
-
8
-
9
-
10
-
11
-
12
-
13
-
14
-
 15
15 -
 16
16 -
 17
17 -
 18
18 -
 19
19 -
 20
20 -
 21
21 -
 22
22 -
 23
23 -
 24
24 -
 25
25 -
 26
26 -
 27
27 -
 28
28 -
 29
29 -
 30
30 -
 31
31 -
 32
32 -
 33
33 -
 34
34 -
 35
35 -
36
-
37
-
38
-
39
-
40
-
41
-
42
-
43
-
44
-
45
-
46
-
47
-
48
-
49
-
50
-
51
-
52
-
53
-
54
-
55
-
56
-
57
-
58
-
59
-
60
-
61
-
62
-
63
-
64
-
65
-
66
-
67
-
68
-
69
-
70
-
71
-
72
-
73
-
74
-
75
-
76
-
77
-
78
-
79
-
80
-
81
-
82
-
83
-
84
-
85
-
86
-
87
-
88
-
89
-
90
-
91
-
92
-
93
-
94
-
95
-
96
-
97
-
98
-
99
-
100
-
101
-
102
-
103
-
104
-
105
-
106
-
107
-
108
-
109
-
110
-
111
-
112
-
113
-
114
-
115
-
116
-
117
-
118
-
119
-
120
-
121
-
122
-
123
-
124
 |
 |
MANAGEMENT DISCUSSION
INTERNATIONAL BUSINESS MACHIN ES CORPORATION AND SUBSI DIARY COMPANIES
23
The company divested its Personal Computing business to Lenovo
on April 30, 2005. The details of this significant transaction are dis-
cussed in note C, “Acquisitions/Divestitures”, on pages 77 and 78. As
a result of this divestiture, the company’s reported financial results do
not include any activity in 2006 and include four months of activity for
the Personal Computing Division in 2005. This lack of comparable
periods has a material impact on the company’s reported revenue
growth. The company believes that a more appropriate analysis is one
that excludes the revenue results of the Personal Computing Division
in 2005 because it presents results on a comparable basis and provides
a more meaningful focus on the company’s ongoing operational per-
formance. Such discussion is presented on pages 24 and 25.
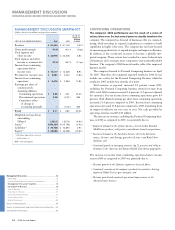
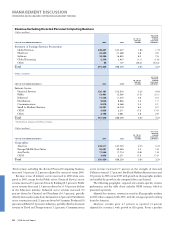
Total revenue, as reported, increased 0.3 percent versus 2005. In
addition to the revenue presentation in the Consolidated Statement of
Earnings, the company also measures revenue performance on both
an industry sector and geographic basis.
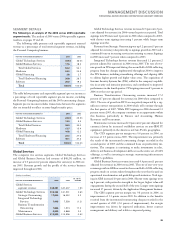
As-reported revenue performance by industry sector was mixed in
2006 when compared to 2005. Revenue in the Financial Services sec-
tor increased 4.1 percent versus the year-ago period, driven by
Banking, which increased 7.2 percent. The Public sector revenue
decline of 4.7 percent was attributable to decreased revenue in the
Government ( 3.2 percent) and Education (25.1 percent) industries.
The Industrial sector revenue decline (1.4 percent) was driven by
Automotive (5.5 percent), partially offset by increased revenue in
Chemical and Petroleum (12.4 percent). Revenue in the Distribution
sector increased (0.8 percent) with growth in Consumer Products
( 5.3 percent) and the Retail industry (2.4 percent), partially offset by
decreased revenue in Travel and Transportation (4.5 percent). The
Communications sector revenue increase (0.9 percent) was driven by
increased revenue in Utilities (9.3 percent). Revenue from Small and
Medium Business decreased 3.5 percent in 2006 when compared to
2005, with revenue declines in all geographic markets. This sector was
impacted most significantly by the loss of the Personal Computing
business revenue.
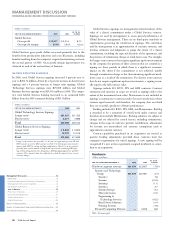
The following geographic, regional and country-specific revenue
performance excludes OEM revenue, which is presented separately.
From a geographic perspective, as-reported revenue performance
was mixed in 2006 compared to 2005, with growth in the Americas
and EMEA, being offset by a decrease in Asia Pacific.
Americas’ revenue increased 1.8 percent (1 percent adjusted for
currency) in 2006 versus the year-ago period. Revenue increased in all
regions with the U.S. up 1.0 percent, Canada 2.4 percent (decreased
4 percent adjusted for currency) and Latin America 8.6 percent ( 3
percent adjusted for currency).
EMEA revenue increased a modest 0.2 percent on an as-reported
basis (declined 1 percent adjusted for currency) in 2006 when com-
pared to 2005. In the major countries, the U.K. increased 0.5 percent
(decreased 1 percent adjusted for currency), France increased 1.6
percent (flat adjusted for currency), Italy increased 1.6 percent (flat
adjusted for currency) and Spain increased 2.1 percent (flat adjusted
for currency). These increases were largely offset by lower revenue in
Germany of 2.8 percent (4 percent adjusted for currency) in 2006
versus the year-ago period.
Asia Pacific revenue declined 5.7 percent (3 percent adjusted for
currency) year over year. Japan, which represents over 50 percent of
the Asia Pacific revenue base, declined 10.1 percent ( 5 percent
adjusted for currency). Partially offsetting the Japan decline were
revenue increases in Korea 12.6 percent and India 22.9 percent.
The emerging countries of Brazil, India, Russia and China
together grew 9.9 percent ( 5 percent adjusted for currency), as the
company continues to invest to build capabilities in these countries.
Brazil grew 15.4 percent (4 percent adjusted for currency), India
increased 22.9 percent (26 percent adjusted for currency) and Russia
increased 13.9 percent (14 percent adjusted for currency). China
declined 0.3 percent (2 percent adjusted for currency) in 2006 as this
country’s performance was significantly impacted by the Personal
Computing divestiture.
OEM revenue increased 17.9 percent (18 percent adjusted for cur-
rency) in 2006 driven by strong demand for game processors in the
Microelectronics business.
Black
MAC
CG10