IBM 2006 Annual Report Download - page 3
Download and view the complete annual report
Please find page 3 of the 2006 IBM annual report below. You can navigate through the pages in the report by either clicking on the pages listed below, or by using the keyword search tool below to find specific information within the annual report.-
 1
1 -
 2
2 -
 3
3 -
 4
4 -
 5
5 -
 6
6 -
 7
7 -
 8
8 -
 9
9 -
 10
10 -
 11
11 -
 12
12 -
 13
13 -
 14
14 -
15
-
16
-
17
-
18
-
19
-
20
-
21
-
22
-
23
-
24
-
25
-
26
-
27
-
28
-
29
-
30
-
31
-
32
-
33
-
34
-
35
-
36
-
37
-
38
-
39
-
40
-
41
-
42
-
43
-
44
-
45
-
46
-
47
-
48
-
49
-
50
-
51
-
52
-
53
-
54
-
55
-
56
-
57
-
58
-
59
-
60
-
61
-
62
-
63
-
64
-
65
-
66
-
67
-
68
-
69
-
70
-
71
-
72
-
73
-
74
-
75
-
76
-
77
-
78
-
79
-
80
-
81
-
82
-
83
-
84
-
85
-
86
-
87
-
88
-
89
-
90
-
91
-
92
-
93
-
94
-
95
-
96
-
97
-
98
-
99
-
100
-
101
-
102
-
103
-
104
-
105
-
106
-
107
-
108
-
109
-
110
-
111
-
112
-
113
-
114
-
115
-
116
-
117
-
118
-
119
-
120
-
121
-
122
-
123
-
124
 |
 |
1
Chairman’s Letter
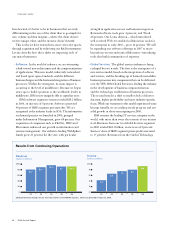
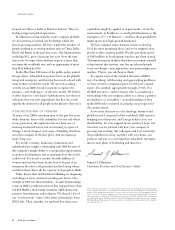
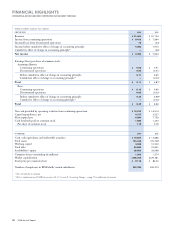
IBM’s gross profit margin rose for the third consecutive
year
—
to 41.9 percent, an increase of 1.8 points in 2006, up
more than five points since 2003. Our pretax income margin
rose to 14.6 percent, an increase of 1.2 points. Both margins
are at their highest in the past 10 years. Significantly, as
I will discuss, they were achieved primarily by remixing our
business to higher-value segments and by driving efficiency
through global integration.
In many respects, IBM is a “higher-torque” engine today.
With revenue growth that matches our segments of the
industry, we have been able to generate strong profit and
cash. In 2006 we generated net cash from operations,
excluding a year-to-year change in Global Financing
receivables, of $15.3 billion — an increase of $2.2 billion
from last year and our highest on record. In addition, net
cash generated from every dollar of revenue has increased
18 percent since 2003. IBM ended 2006 with $10.7 billion
of cash and marketable securities. And of course, stronger
earnings and cash give us more flexibility to increase returns
to you and to invest in future sources of growth.
Our net 2006 cash investment of $3.8 billion for
13 acquisitions
—
nine of them in key strategic areas of
software
—
was up $2.3 billion year to year. After investing
$6.1 billion in R&D and $4.7 billion in net capital
expenditures, we were able to return a record of nearly
$9.8 billion to you
—
$8.1 billion through share repurchase
and $1.7 billion through dividends — or more than 100 percent
of our net earnings. In April 2006 we announced a 50-percent
increase in our quarterly dividend
,
the largest percentage
increase in IBM history and the 362nd consecutive dividend
paid by IBM. This was the 11th year in a row in which we
have increased our dividend. Our balance sheet remains
strong, and the company is well positioned to take advantage
of new strategic opportunities.
IBM had a strong year in 2006. Revenue as reported was
$91.4 billion, up 4 percent, excluding PCs from our 2005 results.
Pretax earnings from continuing operations were $13.3 billion,
an increase of 9 percent. Diluted earnings per share from
continuing operations were $6.06, up 23 percent, marking
16 straight quarters of growth. IBM has consistently generated
return on invested capital significantly above the average for the
S&P 500 over the past several years, and we did so again in 2006,
with ROIC of 34 percent, excluding our Global Financing business.
cyan mag yelo black
MAC