IBM 2006 Annual Report Download - page 81
Download and view the complete annual report
Please find page 81 of the 2006 IBM annual report below. You can navigate through the pages in the report by either clicking on the pages listed below, or by using the keyword search tool below to find specific information within the annual report.-
 1
1 -
2
-
3
-
4
-
5
-
6
-
7
-
8
-
9
-
10
-
11
-
12
-
13
-
14
-
15
-
16
-
17
-
18
-
19
-
20
-
21
-
22
-
23
-
24
-
25
-
26
-
27
-
28
-
29
-
30
-
31
-
32
-
33
-
34
-
35
-
36
-
37
-
38
-
39
-
40
-
41
-
42
-
43
-
44
-
45
-
46
-
47
-
48
-
49
-
50
-
51
-
52
-
53
-
54
-
55
-
56
-
57
-
58
-
59
-
60
-
61
-
62
-
63
-
64
-
65
-
66
-
67
-
68
-
69
-
70
-
 71
71 -
 72
72 -
 73
73 -
 74
74 -
 75
75 -
 76
76 -
 77
77 -
 78
78 -
 79
79 -
 80
80 -
 81
81 -
 82
82 -
 83
83 -
 84
84 -
 85
85 -
 86
86 -
 87
87 -
 88
88 -
 89
89 -
 90
90 -
 91
91 -
92
-
93
-
94
-
95
-
96
-
97
-
98
-
99
-
100
-
101
-
102
-
103
-
104
-
105
-
106
-
107
-
108
-
109
-
110
-
111
-
112
-
113
-
114
-
115
-
116
-
117
-
118
-
119
-
120
-
121
-
122
-
123
-
124
 |
 |

Black
MAC
390 CG10
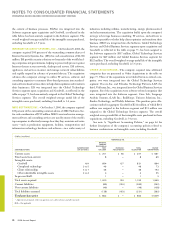
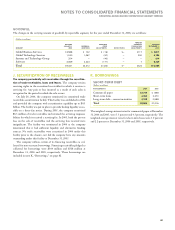
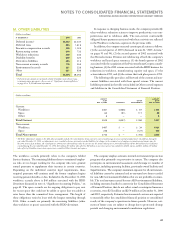
MARKETABLE SECURITIES*
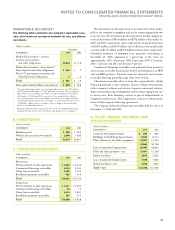
The following table summarizes the company’s marketable secu-
rities, all of which are considered available-for-sale, and alliance
investments.
(Dollars in millions)
FAIR VALUE
AT DECEMBER 31: 2006 2005
Marketable securities—current:
Auction rate securities
and other obligations $, $,
Marketable securities—non-current:**
Time deposits and other obligations $ $
Non-U.S. government securities and
other fixed-term obligations
Total $ $
Non-equity method alliance investments** $ $
* Gross unrealized gains (before taxes) on marketable securities were $19 million
and $31 million at December 31, 2006 and 2005, respectively. Gross unrealized
gains (before taxes) on alliance investments were $178 million and $79 million
at December 31, 2006 and 2005, respectively. Gross unrealized losses (before
taxes) on marketable securities and alliance investments were immaterial to the
Consolidated Financial Statements at December 31, 2006 and 2005. See note N,
“Stockholders’ Equity Activity,” on page 88 for net change in unrealized gains
and losses on marketable securities.
** Included within Investments and sundry assets in the Consolidated Statement of
Financial Position. See note H, “Investments and Sundry Assets,” on page 80.
E. INVENTORIES
(Dollars in millions)
AT DECEMBER 31: 2006 2005
Finished goods $ $
Work in process and raw materials , ,
Total $, $,
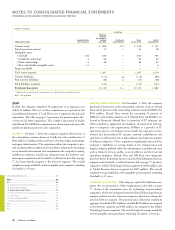
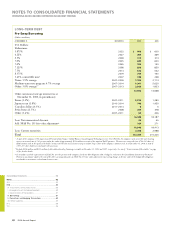
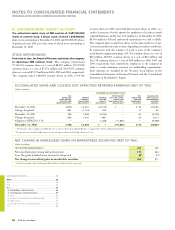
F. FINANCING RECEIVABLES
(Dollars in millions)
AT DECEMBER 31: 2006 2005
Short-term:
Net investment in sales-type leases $ , $ ,
Commercial financing receivables , ,
Client loan receivables , ,
Installment payment receivables
Total $, $,
Long-term:
Net investment in sales-type leases $ , $ ,
Commercial financing receivables
Client loan receivables , ,
Installment payment receivables
Total $, $ ,
Net investment in sales-type leases is for leases that relate princi-
pally to the company’s equipment and are for terms ranging from two
to seven years. Net investment in sales-type leases includes unguaran-
teed residual values of $854 million and $792 million at December 31,
2006 and 2005, respectively, and is reflected net of unearned income
of $1,005 million and $939 million and of allowance for uncollectible
accounts of $135 million and $176 million at those dates, respectively.
Scheduled maturities of minimum lease payments outstanding at
December 31, 2006, expressed as a percentage of the total, are
approximately: 2007, 44 percent; 2008, 28 percent; 2009, 17 percent;
2010, 7 percent; and 2011 and beyond, 4 percent.
Commercial financing receivables arise primarily from inventory
and accounts receivable financing for dealers and remarketers of IBM
and non-IBM products. Payment terms for inventory and accounts
receivable financing generally range from 30 to 90 days.
Client loan receivables relate to loans that are provided by Global
Financing primarily to the company’s clients to finance the purchase
of the company’s software and services. Separate contractual relation-
ships on these financing arrangements are for terms ranging from two
to seven years. Each financing contract is priced independently at
competitive market rates. The company has a history of enforcing the
terms of these separate financing agreements.
The company did not have financing receivables held for sale as of
December 31, 2006 and 2005.
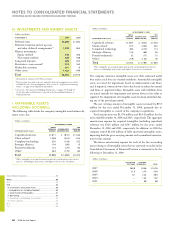
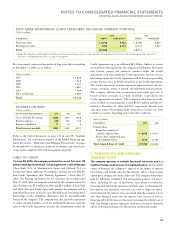
G. PLANT, RENTAL MACHINES AND
OTHER PROPERTY
(Dollars in millions)
AT DECEMBER 31: 2006 2005
Land and land improvements $ $
Buildings and building improvements , ,
Plant, laboratory and office equipment , ,
, ,
Less: Accumulated depreciation , ,
Plant and other property—net , ,
Rental machines , ,
Less: Accumulated depreciation , ,
Rental machines—net , ,
Total—net $, $,
NOTES TO CONSOLIDATED FINANCIAL STATEMENTS
INTERNATIONAL BUSINESS MACHINES CORPORATION AND SUBSIDIARY COMPANIES
79