IBM 2006 Annual Report Download - page 33
Download and view the complete annual report
Please find page 33 of the 2006 IBM annual report below. You can navigate through the pages in the report by either clicking on the pages listed below, or by using the keyword search tool below to find specific information within the annual report.-
 1
1 -
2
-
3
-
4
-
5
-
6
-
7
-
8
-
9
-
10
-
11
-
12
-
13
-
14
-
15
-
16
-
17
-
18
-
19
-
20
-
21
-
22
-
 23
23 -
 24
24 -
 25
25 -
 26
26 -
 27
27 -
 28
28 -
 29
29 -
 30
30 -
 31
31 -
 32
32 -
 33
33 -
 34
34 -
 35
35 -
 36
36 -
 37
37 -
 38
38 -
 39
39 -
 40
40 -
 41
41 -
 42
42 -
 43
43 -
44
-
45
-
46
-
47
-
48
-
49
-
50
-
51
-
52
-
53
-
54
-
55
-
56
-
57
-
58
-
59
-
60
-
61
-
62
-
63
-
64
-
65
-
66
-
67
-
68
-
69
-
70
-
71
-
72
-
73
-
74
-
75
-
76
-
77
-
78
-
79
-
80
-
81
-
82
-
83
-
84
-
85
-
86
-
87
-
88
-
89
-
90
-
91
-
92
-
93
-
94
-
95
-
96
-
97
-
98
-
99
-
100
-
101
-
102
-
103
-
104
-
105
-
106
-
107
-
108
-
109
-
110
-
111
-
112
-
113
-
114
-
115
-
116
-
117
-
118
-
119
-
120
-
121
-
122
-
123
-
124
 |
 |

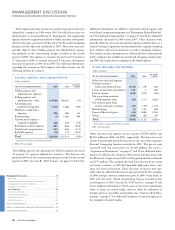
Systems and Technology Group revenue increased 4.7 percent
(4 percent adjusted for currency) in 2006 versus 2005. System z rev-
enue increased reflecting continued strong customer acceptance of
both specialty engines for Linux and Java workloads and traditional
mainframe workloads. MIPS shipments increased 11 percent versus
2005. System x revenue increased driven by increased server revenue
( 5.3 percent) and System x blades growth of 22.3 percent. IBM
BladeCenter offers clients unique power and cooling capabilities and
the flexibility to efficiently handle various workloads. In addition to
the company’s System x blades, the company offers POWER blades
and blades utilizing the Cell Broadband Engine. Total blade growth,
including System p blades, was 24.6 percent in 2006 versus 2005.
Although System p revenue declined for the year, high-end server
revenue increased 9.4 percent. In the third quarter the company com-
pleted its transition to POWER5+ and expanded the implementation
of POWER Quadcore technology to all POWER-based entry level
System p products. These transitions allowed the company to sustain
the price/performance and virtualization leadership position that
has made the company the number one UNIX vendor worldwide.
System i revenue declined as the company completed its transition to
POWER5+ in the third quarter, however clients continued to lever-
age their existing capacity.
System Storage revenue growth was driven by Total disk growth
of 7.8 percent, while tape grew 3.1 percent in 2006 versus 2005.
Within Total disk, mid-range disk revenue increased 16.5 percent and
storage area network products increased 10.6 percent, while enter-
prise products revenue declined 6.7 percent in 2006 versus 2005. The
revenue increase in tape products was primarily driven by the new
tape security offering which includes unique encryption capabilities.
Microelectronics revenue increased due to strong demand in the
game processor business and networking components.
Retail Stores Solutions revenue increased primarily due to clients
replacing older technology in favor of integrated retail solutions.
Printing Systems revenue decreased due primarily to lower mainte-
nance revenue as a result of a declining install base and lower sales of
hardware products.
Personal Computing Division revenue decreased as a result of the
company divesting its Personal Computing business to Lenovo on
April 30, 2005. The 2006 results do not include any revenue while the
2005 results include four months of revenue. See note C, “Acquisitions/
Divestitures,” on pages 77 and 78 for additional information.
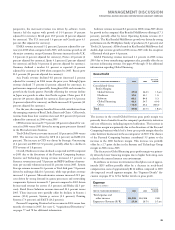
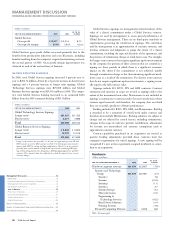
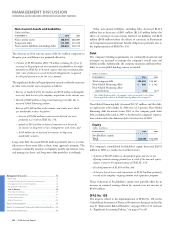
(Dollars in millions)
YR. TO YR.
FOR THE YEAR ENDED DECEMBER 31: 2006 2005 CHANGE
Hardware:
Gross profit $, $, (.)%
Gross profit margin .% .% . pts.
The decrease in gross profit dollars for 2006 versus 2005 was primarily
due to the absence of the Personal Computing business. The increase
in gross profit margin was also primarily due to the divestiture of the
Personal Computing business (which had a lower gross profit margin
than the other hardware products) in the second quarter of 2005.
This divestiture contributed 3.5 points of the improvement in the
Hardware margin.
Systems and Technology Group gross profit margins declined 2.7
points to 37.7 percent in 2006 versus 2005. The decline in gross profit
margin was driven by revenue mix towards lower margin products in
2006 versus 2005 (2.5 points) and pricing pressure in the company’s
low- and mid-range server brands.
Differences between the Hardware segment gross profit margin
and gross profit dollar amounts above and the amounts reported on
page 25 (and derived from page 56) primarily relate to the impact of
certain cost hedging transactions (see “Anticipated Royalties and Cost
Transactions” on page 84) as well as the ongoing warranty costs asso-
ciated with the divested Personal Computing business. The recorded
amounts for these transactions are considered unallocated corporate
amounts for purposes of measuring the segment’s gross margin perfor-
mance and therefore are not included in the segment results above.
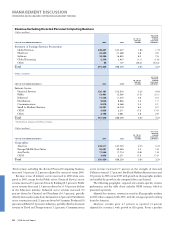
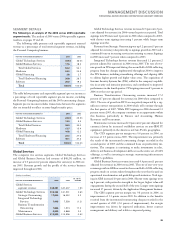
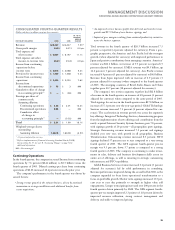
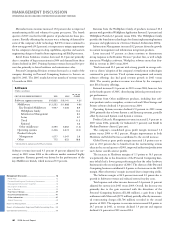
Software
(Dollars in millions)
YR. TO YR.
FOR THE YEAR ENDED DECEMBER 31: 2006 2005* CHANGE
Software segment revenue: $, $, .%
Middleware $, $, .%
Key Branded Middleware , , .
WebSphere family .
Information Management .
Lotus .
Tivoli .
Rational .
Other middleware , , (.)
Operating systems , , (.)
Product Lifecycle
Management , , .
Other .
* Reclassified to conform with 2006 presentation.
Software revenue increased 7.9 percent (7 percent adjusted for cur-
rency) in 2006 versus 2005 reflecting strong demand for the company’s
industry-leading middleware capabilities. The revenue growth was
driven from both organic sources and the company’s targeted acquisi-
tions. The company’s leadership in technology and innovation has
allowed it to continue to capitalize on industry trends such as SOA
and Information on Demand.
Key Branded Middleware is made up of five key brands which
provide an integrated suite for the company’s customers. All five
brands grew in 2006, reflecting continued momentum and benefit
from the company’s sales and development investments along with
additional benefit from acquisitions.
MANAGEMENT DISCUSSION
INTERNATIONAL BUSINESS MACHINES CORPORATION AND SUBSIDIARY COMPANIES
31
Black
MAC
2718 CG10