IBM 2006 Annual Report Download - page 110
Download and view the complete annual report
Please find page 110 of the 2006 IBM annual report below. You can navigate through the pages in the report by either clicking on the pages listed below, or by using the keyword search tool below to find specific information within the annual report.-
 1
1 -
2
-
3
-
4
-
5
-
6
-
7
-
8
-
9
-
10
-
11
-
12
-
13
-
14
-
15
-
16
-
17
-
18
-
19
-
20
-
21
-
22
-
23
-
24
-
25
-
26
-
27
-
28
-
29
-
30
-
31
-
32
-
33
-
34
-
35
-
36
-
37
-
38
-
39
-
40
-
41
-
42
-
43
-
44
-
45
-
46
-
47
-
48
-
49
-
50
-
51
-
52
-
53
-
54
-
55
-
56
-
57
-
58
-
59
-
60
-
61
-
62
-
63
-
64
-
65
-
66
-
67
-
68
-
69
-
70
-
71
-
72
-
73
-
74
-
75
-
76
-
77
-
78
-
79
-
80
-
81
-
82
-
83
-
84
-
85
-
86
-
87
-
88
-
89
-
90
-
91
-
92
-
93
-
94
-
95
-
96
-
97
-
98
-
99
-
 100
100 -
 101
101 -
 102
102 -
 103
103 -
 104
104 -
 105
105 -
 106
106 -
 107
107 -
 108
108 -
 109
109 -
 110
110 -
 111
111 -
 112
112 -
 113
113 -
 114
114 -
 115
115 -
 116
116 -
 117
117 -
 118
118 -
 119
119 -
 120
120 -
121
-
122
-
123
-
124
 |
 |

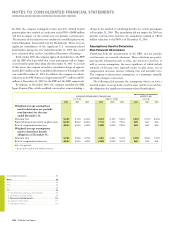
HEALTHCARE COST TREND RATE
For nonpension postretirement benefit plan accounting, the company
reviews external data and its own historical trends for healthcare costs
to determine the healthcare cost trend rates. However, the healthcare
cost trend rate has an insignificant effect on plan costs and obligations
as a result of the terms of the plan which limit the company’s obliga-
tion to the participants. The company assumes that the healthcare
cost trend rate for 2007 will be 8 percent. In addition, the company
assumes that the same trend rate will decrease to 5 percent over the
next four years. A one percentage point increase or decrease in the
assumed healthcare cost trend rate would not have a material effect on
net periodic cost/(income) or the benefit obligation as of December
31, 2006 and 2005.
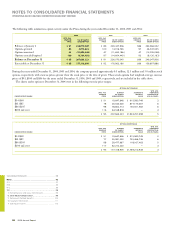
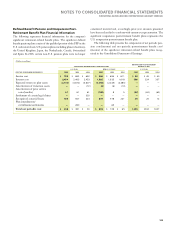
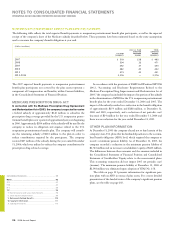
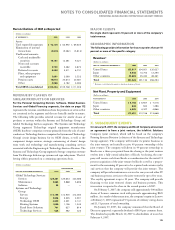
Plan Assets
DEFINED BENEFIT PENSION PLANS
The company’s defined benefit pension plans’ asset allocations at
December 31, 2006 and 2005 and target allocation for 2007, by asset
category, are as follows:
U.S. Plans (Actual Allocations)
PLAN ASSETS 2007
AT DECEMBER 31: TARGET
2006 2005 ALLOCATION
Asset Category:
Equity securities* .% .% %
Debt securities . .
Real Estate . .
Other . —
Total .% .% %
* See the following discussion regarding certain private market assets, and future
funding commitments thereof, that are not as liquid as the rest of the publicly
traded securities.
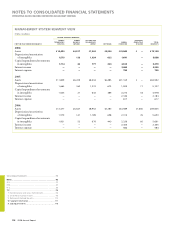
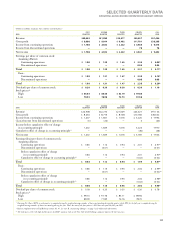
NOTES TO CONSOLIDATED FINANCIAL STATEMENTS
INTERNATIONAL BUSINESS MACHINES CORPORATION AND SUBSIDIARY COMPANIES
Material Non-U.S. Plans (Weighted-Average)
PLAN ASSETS 2007
AT DECEMBER 31: TARGET
2006 2005* ALLOCATION
Asset Category:
Equity securities .% .% %
Debt securities . .
Real estate . .
Other . . —
Total .% .% %
* Reclassified to conform with 2006 presentation.
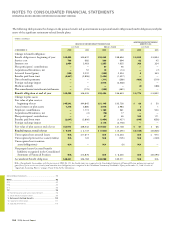
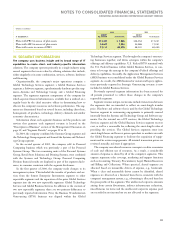
The investment objectives of the PPP portfolio (the Fund) are
designed to generate returns that will enable the Fund to meet its
future obligations. The precise amount for which these obligations
will be settled depends on future events, including the retirement
dates and life expectancy of the Plans’ participants and salary inflation.
The obligations are estimated using actuarial assumptions, based on
the current economic environment. The Fund’s investment strategy
balances the requirement to generate returns, using potentially higher
yielding assets such as equity securities, with the need to control risk
in the Fund with less volatile assets, such as fixed-income securities.
Risks include, among others, inflation, volatility in equity values and
changes in interest rates that could cause the Plans to become under-
funded, thereby increasing their dependence on contributions from
the company. Within each asset class, careful consideration is given to
balancing the portfolio among industry sectors, geographies, interest
rate sensitivity, dependence on economic growth, currency and other
factors that affect investment returns.
The assets are managed by professional investment firms, as well
as by investment professionals who are employees of the company.
They are bound by precise mandates and are measured against spe-
cific benchmarks. Among these managers, consideration is given, but
not limited to, balancing security concentration, issuer concentration,
investment style and reliance on particular active and passive invest-
ment strategies. Market liquidity risks are tightly controlled, with
only a small percentage of the PPP portfolio invested in private market
assets consisting of private equities and private real estate investments,
which are less liquid than publicly traded securities. The PPP
included private market assets comprising approximately 10.2 percent
and 10.5 percent of total assets at December 31, 2006 and 2005,
respectively. The target allocation for private market assets in 2007 is
10.2 percent. As of December 31, 2006, the Fund has $3,821 million
in commitments for future private market investments to be made
over a number of years. These commitments are expected to be
funded from plan assets. Derivatives are primarily used to hedge cur-
rency, adjust portfolio duration and reduce specific market risks.
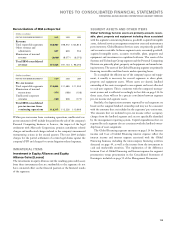
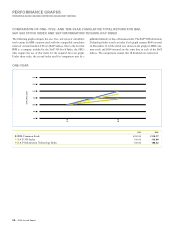
108 2006 Annual Report
Consolidated Statements .........................................................
Notes .....................................................................................
A-G .........................................................................................
H-M .........................................................................................
N-S ..........................................................................................
T-X ..........................................................................................
T. Rental Expense and Lease Commitments .......................
U. Stock-Based Compensation ............................................
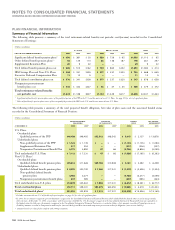
V. Retirement-Related Benefits ......................................... 100
W. Segment Information.................................................... 111
X. Subsequent Events ........................................................ 115
Black
MAC
390 CG10