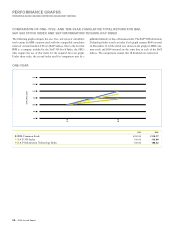
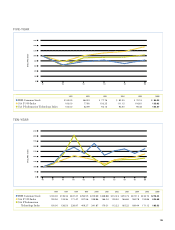
IBM 2006 Annual Report Download - page 117
Download and view the complete annual report
Please find page 117 of the 2006 IBM annual report below. You can navigate through the pages in the report by either clicking on the pages listed below, or by using the keyword search tool below to find specific information within the annual report.-
 1
1 -
2
-
3
-
4
-
5
-
6
-
7
-
8
-
9
-
10
-
11
-
12
-
13
-
14
-
15
-
16
-
17
-
18
-
19
-
20
-
21
-
22
-
23
-
24
-
25
-
26
-
27
-
28
-
29
-
30
-
31
-
32
-
33
-
34
-
35
-
36
-
37
-
38
-
39
-
40
-
41
-
42
-
43
-
44
-
45
-
46
-
47
-
48
-
49
-
50
-
51
-
52
-
53
-
54
-
55
-
56
-
57
-
58
-
59
-
60
-
61
-
62
-
63
-
64
-
65
-
66
-
67
-
68
-
69
-
70
-
71
-
72
-
73
-
74
-
75
-
76
-
77
-
78
-
79
-
80
-
81
-
82
-
83
-
84
-
85
-
86
-
87
-
88
-
89
-
90
-
91
-
92
-
93
-
94
-
95
-
96
-
97
-
98
-
99
-
100
-
101
-
102
-
103
-
104
-
105
-
106
-
 107
107 -
 108
108 -
 109
109 -
 110
110 -
 111
111 -
 112
112 -
 113
113 -
 114
114 -
 115
115 -
 116
116 -
 117
117 -
 118
118 -
 119
119 -
 120
120 -
 121
121 -
 122
122 -
 123
123 -
 124
124
 |
 |

Black
MAC
390 CG10
NOTES TO CONSOLIDATED FINANCIAL STATEMENTS
INTERNATIONAL BUSINESS MACHINES CORPORATION AND SUBSIDIARY COMPANIES
115
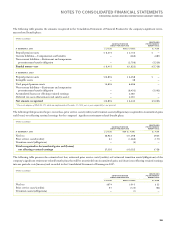
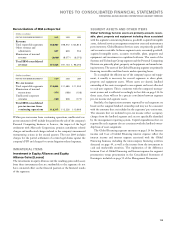
Reconciliations of IBM as Reported
(Dollars in millions)
AT DECEMBER 31: 2006 2005 2004
Assets:
Total reportable segments $ , $ , $ ,
Elimination of internal
transactions (,) (,) (,)
Unallocated amounts:
Cash and marketable
securities , , ,
Notes and accounts
receivable , , ,
Deferred tax assets , , ,
Plant, other property
and equipment , , ,
Pension assets , , ,
Other , , ,
Total IBM consolidated $, $, $,
REVENUE BY CLASSES OF
SIMILAR PRODUCTS OR SERVICES
For the Personal Computing Division, Software, Global Business
Services and Global Financing segments, the data on page 112
represents the revenue contributions from the products or services that
are contained in the segments and that are basically similar in nature.
The following table provides external revenue for similar classes of
products or services within the Systems and Technology Group and
Global Technology Services segments. The Systems and Technology
Group segment’s Technology original equipment manufacturer
(OEM) hardware comprises revenue primarily from the sale of semi-
conductors. Technology Services comprise the Systems and Technology
Group’s circuit design business for its OEM clients, as well as the
component design services, strategic outsourcing of clients’ design
team work and technology and manufacturing consulting services
associated with the Engineering & Technology Services Division. The
Systems and Technology Group segment’s Storage comprises revenue
from TotalStorage disk storage systems and tape subsystems. The fol-
lowing table is presented on a continuing operations basis.
(Dollars in millions)
CONSOLIDATED
FOR THE YEAR ENDED DECEMBER 31: 2006 2005 2004
Global Technology Services:
Services $, $, $,
Maintenance , , ,
Software — —
Systems and Technology
Group:
Servers $, $, $,
Storage , , ,
Technology OEM , , ,
Printing Systems , , ,
Retail Store Solutions
Technology Services
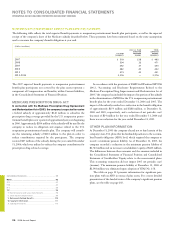
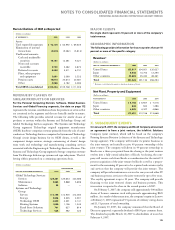
MAJOR CLIENTS
No single client represents 10 percent or more of the company’s
total revenue.
GEOGRAPHIC INFORMATION
The following provides information for those countries that are 10
percent or more of the specific category.
Revenue*
(Dollars in millions)
FOR THE YEAR ENDED DECEMBER 31: 2006 2005 2004
United States $, $, $,
Japan , , ,
Other countries , , ,
Total $, $, $,
* Revenue is attributed to countries based on location of client.
Net Plant, Property and Equipment
(Dollars in millions)
AT DECEMBER 31: 2006 2005 2004
United States $ , $ , $ ,
Japan ,
Other countries , , ,
Total $, $, $,
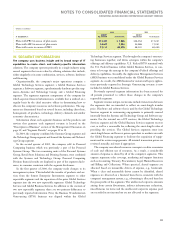
X. SUBSEQUENT EVENTS
On January 25, 2007, the company and Ricoh Company announced
an agreement to form a joint venture, the InfoPrint Solutions
Company (joint venture), which will be based on the company’s
Printing Systems Division (a division of the Systems and Technology
Group segment). The company will transfer its printer business to
the joint venture and initially receive 49 percent ownership of the
joint venture. The company will divest its 49 percent ownership to
Ricoh over a three-year period from the closing as the joint venture
evolves into a fully owned subsidiary of Ricoh. At closing, the com-
pany will receive cash from Ricoh as consideration for the initial 51
percent acquisition of the joint venture by Ricoh as well as a prepay-
ment for the remaining 49 percent to be acquired and certain royalty
and services that the company will provide the joint venture. The
company will provide maintenance services for one year and other IT
and business process services to the joint venture for up to five years.
The royalty agreement is up to 10 years. The company will provide
financing to the joint venture’s clients and business partners. This
transaction is expected to close in the second quarter of 2007.
On February 5, 2007, the company sold approximately 300 million
shares of Lenovo common stock with proceeds approximating $120
million. As a result of this transaction, the company’s equity in Lenovo
at February 5, 2007 represented 9.9 percent of ordinary voting shares
and 11.31 percent of total ownership.
On January 30, 2007, the company announced that the Board of
Directors approved a quarterly dividend of $0.30 per common share.
The dividend is payable March 10, 2007 to shareholders of record on
February 9, 2007.