IBM 2006 Annual Report Download - page 41
Download and view the complete annual report
Please find page 41 of the 2006 IBM annual report below. You can navigate through the pages in the report by either clicking on the pages listed below, or by using the keyword search tool below to find specific information within the annual report.-
 1
1 -
2
-
3
-
4
-
5
-
6
-
7
-
8
-
9
-
10
-
11
-
12
-
13
-
14
-
15
-
16
-
17
-
18
-
19
-
20
-
21
-
22
-
23
-
24
-
25
-
26
-
27
-
28
-
29
-
30
-
 31
31 -
 32
32 -
 33
33 -
 34
34 -
 35
35 -
 36
36 -
 37
37 -
 38
38 -
 39
39 -
 40
40 -
 41
41 -
 42
42 -
 43
43 -
 44
44 -
 45
45 -
 46
46 -
 47
47 -
 48
48 -
 49
49 -
 50
50 -
 51
51 -
52
-
53
-
54
-
55
-
56
-
57
-
58
-
59
-
60
-
61
-
62
-
63
-
64
-
65
-
66
-
67
-
68
-
69
-
70
-
71
-
72
-
73
-
74
-
75
-
76
-
77
-
78
-
79
-
80
-
81
-
82
-
83
-
84
-
85
-
86
-
87
-
88
-
89
-
90
-
91
-
92
-
93
-
94
-
95
-
96
-
97
-
98
-
99
-
100
-
101
-
102
-
103
-
104
-
105
-
106
-
107
-
108
-
109
-
110
-
111
-
112
-
113
-
114
-
115
-
116
-
117
-
118
-
119
-
120
-
121
-
122
-
123
-
124
 |
 |

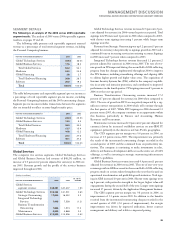
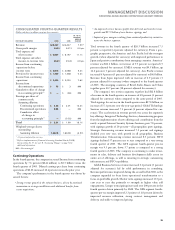
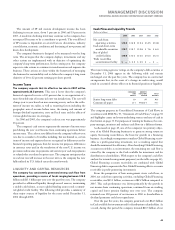
The following is an analysis of the reportable segment results for
Global Services, Hardware and Software. The Global Financing analy-
sis is included in the Global Financing section on pages 49 and 50.
Global Services
Global Services revenue increased 2.4 percent (2.0 percent adjusted
for currency) in 2005 versus 2004.
(Dollars in millions)
YR. TO YR.
FOR THE YEAR ENDED DECEMBER 31: 2005 2004 CHANGE
Global Services
segment revenue: $, $, .%
Global Technology Services $, $, .%
Strategic Outsourcing , , .
Integrated Technology
Services , , .
Business Transformation
Outsourcing , .
Maintenance , , .
Global Business Services $, $, (.)%
Global Technology Services revenue increased 4.7 percent (4 percent
adjusted for currency). Although SO revenue continued to grow
( 3.5 percent), it experienced a slowdown in its revenue growth rate
due to the impact of high levels of backlog erosion experienced in
2004 and the cumulative effect of lower signings, starting in 2004
through the first quarter of 2005. SO revenue growth was driven by
EMEA (10 percent) and Asia Pacific (1 percent), while the Americas
was essentially flat. ITS signings were down 7 percent in 2005 versus
2004. The ITS business is more dependent upon short-term signings
for revenue growth and signings declines in the third and fourth
quarter impacted the overall revenue growth rate (1.3 percent) for
2005. The company began to rebalance its ITS offerings and shift its
business development and delivery capabilities and skills to higher
growth areas in the third quarter of 2005. The company’s BTO busi-
ness continued its strong year-to-year growth (59.2 percent) due to
signings performance in both 2004 and 2005. Revenue growth was
strong across all geographies.
Global Business Services revenue decreased 1.8 percent (2 per-
cent adjusted for currency) in 2005 versus 2004. Revenue declined 10
percent in both Asia Pacific and EMEA and increased in the Americas
by 14 percent. The company’s Consulting and Systems Integration
business had many areas of growth, with strong performance in the
Strategy and Change and Supply Chain Management practices. This
overall growth was mitigated by weakness year to year in Japan,
Germany and the company’s Federal Business in the U.S. However,
across all practices, the company drove improved resource utilization
and pricing trends remained stable to improving.
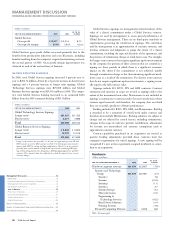
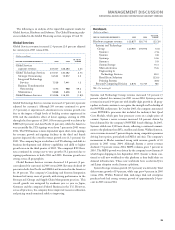
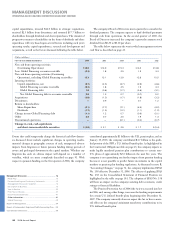
Hardware
(Dollars in millions)
YR. TO YR.
FOR THE YEAR ENDED DECEMBER 31: 2005 2004 CHANGE
Hardware segment revenue: $, $, (.)%
Systems and Technology
Group $, $, .%
System z (.)
System i .
System p .
System x .
System Storage .
Microelectronics .
Engineering &
Technology Services .
Retail Store Solutions (.)
Printing Systems (.)
Personal Computing Division , , NM
NM—Not meaningful
Systems and Technology Group revenue increased 5.0 percent (5
percent adjusted for currency) in 2005 versus 2004. System p server
revenue increased 14.6 percent with double-digit growth in all geog-
raphies as clients continue to recognize the strength and leadership of
the POWER architecture. In October 2005, the company announced
a new POWER5+ processor that included the industry’s first Quad
Core Module, which puts four processor cores on a single piece of
ceramic. System i server revenue increased 0.8 percent driven by
broad demand for the company’s POWER5 based offerings. In 2005,
System i added over 2,500 new clients, reflecting a continued commit-
ment to the platform from ISVs, resellers and clients. Within System x,
server revenue increased 7 percent despite strong competitive pressures
driving lower prices, particularly in EMEA and Asia. The company’s
momentum in Blades remained strong with revenue growth of 65
percent in 2005 versus 2004. Although System z server revenue
declined 7.6 percent versus 2004, MIPS volumes grew 7 percent in
2005. The MIPS growth was driven by the company’s new System z9
which began shipping in late September 2005. System z clients con-
tinued to add new workloads to this platform as they build their on
demand infrastructure. These new workloads have accelerated Java
and Linux adoption on the System z platform.
System Storage revenue growth (15.3 percent) was driven by Total
disk revenue growth of 19 percent, while tape grew 9 percent in 2005
versus 2004. Within External disk, mid-range disk and enterprise
products both had strong revenue growth of approximately 24 per-
cent in 2005 versus 2004.
MANAGEMENT DISCUSSION
INTERNATIONAL BUSINESS MACHIN ES CORPORATION AND SUBSI DIARY COMPANIES
39
Black
MAC
2718 CG10