IBM 2006 Annual Report Download - page 45
Download and view the complete annual report
Please find page 45 of the 2006 IBM annual report below. You can navigate through the pages in the report by either clicking on the pages listed below, or by using the keyword search tool below to find specific information within the annual report.-
 1
1 -
2
-
3
-
4
-
5
-
6
-
7
-
8
-
9
-
10
-
11
-
12
-
13
-
14
-
15
-
16
-
17
-
18
-
19
-
20
-
21
-
22
-
23
-
24
-
25
-
26
-
27
-
28
-
29
-
30
-
31
-
32
-
33
-
34
-
 35
35 -
 36
36 -
 37
37 -
 38
38 -
 39
39 -
 40
40 -
 41
41 -
 42
42 -
 43
43 -
 44
44 -
 45
45 -
 46
46 -
 47
47 -
 48
48 -
 49
49 -
 50
50 -
 51
51 -
 52
52 -
 53
53 -
 54
54 -
 55
55 -
56
-
57
-
58
-
59
-
60
-
61
-
62
-
63
-
64
-
65
-
66
-
67
-
68
-
69
-
70
-
71
-
72
-
73
-
74
-
75
-
76
-
77
-
78
-
79
-
80
-
81
-
82
-
83
-
84
-
85
-
86
-
87
-
88
-
89
-
90
-
91
-
92
-
93
-
94
-
95
-
96
-
97
-
98
-
99
-
100
-
101
-
102
-
103
-
104
-
105
-
106
-
107
-
108
-
109
-
110
-
111
-
112
-
113
-
114
-
115
-
116
-
117
-
118
-
119
-
120
-
121
-
122
-
123
-
124
 |
 |

MANAGEMENT DISCUSSION
INTERNATIONAL BUSINESS MACHIN ES CORPORATION AND SUBSI DIARY COMPANIES
43
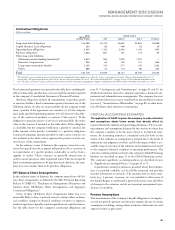
The amount of IP and custom development income has been
declining in recent years, down 5 percent in 2006 and 19 percent in
2005. A moderate declining trend may continue as the company does
not expect IP income to be a contributor to growth. The overall level
of IP income is dependent on several factors: divestitures, industry
consolidation, economic conditions and the timing of new patents and
know-how development.
The company’s business is designed to be measured over the long
term. The strategies that the company deploys, investments and any
other actions are implemented with an objective of optimizing the
company’s long-term performance. In the coming year, the company
expects to take actions to continue its transformation and improve the
business. These actions are done within the framework of managing
the business for sustainability and to deliver the company’s long-term
objective of 10 to 12 percent earnings per share growth.
Income Taxes
The company expects that its effective tax rate in 2007 will be
approximately 28.5 percent. This rate is lower than the company’s
historical expected tax rate of 30 percent due to an expectation of a
more favorable mix of income in lower tax jurisdictions. The rate will
change year to year based on non-recurring events, such as the settle-
ment of income tax audits, as well as recurring factors including the
geographic mix of income before taxes, the timing and amount of
foreign dividend repatriation, state and local taxes and the effects of
various global income tax strategies.
In 2006 and 2005, the company’s cash tax rate was approximately
16 percent.
The company’s cash tax rate represents the amount of income taxes
paid during the year over Income from continuing operations before
income taxes. The cash tax rate differs from the company’s effective tax
rate due to a number of variables including, but not limited to, certain
items of income and expense that are recognized in different years for
financial reporting purposes than for income tax purposes, differences
in currency rates used in the translation of the non-U.S. income tax
provision and income tax payments and current year cash tax payments
or refunds that are related to prior years. The company anticipates that
its cash tax rate will increase in the near term as the company has now
fully utilized its U.S. federal tax credit carryforwards.
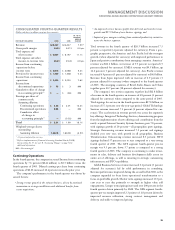
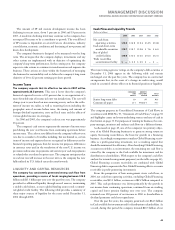
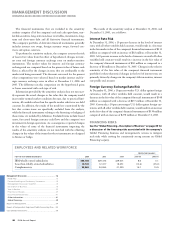
LIQUIDITY AND CAPITAL RESOURCES
The company has consistently generated strong cash flow from
operations, providing a source of funds ranging between $13.8
billion and $15.3 billion per year over the past five years. The company
provides for additional liquidity through several sources; maintaining
a sizable cash balance, access to global funding sources and a commit-
ted global credit facility. The following table provides a summary of
these major sources of liquidity for the years ended December 31,
2002 through 2006.
Cash Flow and Liquidity Trends
(Dollars in billions)
2006 2005 2004 2003 2002
Net cash from
operating activities $. $. $. $. $.
Cash and short-term
marketable securities $. $. $. $ . $ .
Size of global
credit facilities $. $. $. $. $.
Trade receivables
securitization facility $ — $ . $ . $ — $ —
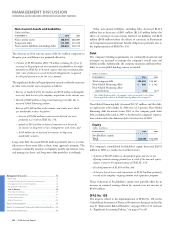
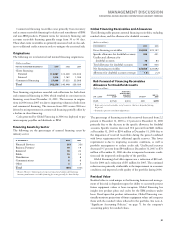
The major rating agencies’ ratings on the company’s debt securities at
December 31, 2006 appear in the following table and remain
unchanged over the past five years. The company has no contractual
arrangements that, in the event of a change in credit rating, would
result in a material adverse effect on its financial position or liquidity.
STANDARD MOODY’S
AND INVESTORS FITCH
POOR’S SERVICE RATINGS
Senior long-term debt A+ A AA-
Commercial paper A- Prime- F+
The company prepares its Consolidated Statement of Cash Flows in
accordance with SFAS No. 95, “Statement of Cash Flows,” on page 58
and highlights causes and events underlying sources and uses of cash in
that format on page 33. For purposes of running its business, the com-
pany manages, monitors and analyzes cash flows in a different format.
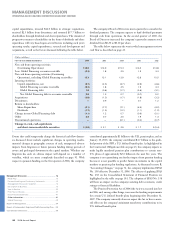
As discussed on page 49, one of the company’s two primary objec-
tives of its Global Financing business is to generate strong return on
equity. Increasing receivables is the basis for growth in a financing
business. Accordingly, management considers Global Financing receiv-
ables as a profit-generating investment, not as working capital that
should be minimized for efficiency. After classifying Global Financing
accounts receivables as an investment, the remaining net cash flow is
viewed by the company as the Cash available for investment and for
distribution to shareholders. With respect to the company’s cash flow
analysis for internal management purposes (see the table on page 44),
Global Financing accounts receivables are combined with Global
Financing debt to represent the Net Global Financing debt to accounts
receivable (a profit-generating investment).
From the perspective of how management views cash flows, in
2006, net cash from operating activities, excluding Global Financing
receivables, was $15.3 billion, an increase of $2.2 billion compared to
2005. This cash performance was driven primarily by the growth in
net income from continuing operations, continued focus on working
capital and lower pension funding year over year. The company
returned over 100 percent of net income in 2006 to shareholders in
dividend payments and share repurchases.
Over the past five years, the company generated over $64.3 billion
in Cash available for investment and for distribution to shareholders. As
a result, during that period the company invested $20.5 billion of net
Black
MAC
2718 CG10