Berkshire Hathaway 2013 Annual Report Download - page 98
Download and view the complete annual report
Please find page 98 of the 2013 Berkshire Hathaway annual report below. You can navigate through the pages in the report by either clicking on the pages listed below, or by using the keyword search tool below to find specific information within the annual report.-
 1
1 -
2
-
3
-
4
-
5
-
6
-
7
-
8
-
9
-
10
-
11
-
12
-
13
-
14
-
15
-
16
-
17
-
18
-
19
-
20
-
21
-
22
-
23
-
24
-
25
-
26
-
27
-
28
-
29
-
30
-
31
-
32
-
33
-
34
-
35
-
36
-
37
-
38
-
39
-
40
-
41
-
42
-
43
-
44
-
45
-
46
-
47
-
48
-
49
-
50
-
51
-
52
-
53
-
54
-
55
-
56
-
57
-
58
-
59
-
60
-
61
-
62
-
63
-
64
-
65
-
66
-
67
-
68
-
69
-
70
-
71
-
72
-
73
-
74
-
75
-
76
-
77
-
78
-
79
-
80
-
81
-
82
-
83
-
84
-
85
-
86
-
87
-
 88
88 -
 89
89 -
 90
90 -
 91
91 -
 92
92 -
 93
93 -
 94
94 -
 95
95 -
 96
96 -
 97
97 -
 98
98 -
 99
99 -
 100
100 -
 101
101 -
 102
102 -
 103
103 -
 104
104 -
 105
105 -
 106
106 -
 107
107 -
 108
108 -
109
-
110
-
111
-
112
-
113
-
114
-
115
-
116
-
117
-
118
-
119
-
120
-
121
-
122
-
123
-
124
-
125
-
126
-
127
-
128
-
129
-
130
-
131
-
132
-
133
-
134
-
135
-
136
-
137
-
138
-
139
-
140
 |
 |

Management’s Discussion (Continued)
Property and casualty losses (Continued)
General Re (Continued)
international proportional reserve cells) would produce a net increase in our nominal IBNR reserves and a corresponding
reduction in pre-tax earnings of approximately $978 million. We believe it is reasonably possible for the tails of the expected
loss emergence patterns and expected loss ratios to increase at these rates in any of the individual aforementioned reserve cells.
However, given the diversification in worldwide business, more likely outcomes are believed to be less than $978 million.
In 2013, our property results included estimated losses incurred of $400 million from significant catastrophe events during
the year. In 2013, reported claims for prior years’ property loss events were less than expected, and we reduced our estimated
ultimate liabilities by $375 million. However, the nature of property loss experience tends to be more volatile because of the
effect of catastrophes and large individual property losses.
In certain reserve cells within excess directors and officers and errors and omissions (“D&O and E&O”) coverages, IBNR
reserves are based on estimated ultimate losses without consideration of expected emergence patterns. These cells often involve
a spike in loss activity arising from recent industry developments making it difficult to select an expected loss emergence
pattern. For our large D&O and E&O reserve cells, an increase of ten points in the tail of the expected emergence pattern (for
those cells where emergence patterns are considered) and an increase of ten percent in the expected loss ratios would produce a
net increase in nominal IBNR reserves and a corresponding reduction in pre-tax earnings of approximately $153 million. We
believe it is reasonably possible for the tail of the expected loss emergence patterns and expected loss ratios to increase at these
rates.
Overall industry-wide loss experience data and informed judgment are used when internal loss data is of limited reliability,
such as in setting the estimates for mass tort, asbestos and hazardous waste (collectively, “mass tort”) claims. Gross unpaid
mass tort liabilities at December 31, 2013 and 2012 were approximately $1.5 billion and $1.6 billion, respectively and net of
reinsurance, were approximately $1.2 billion at the end of each of the last two years. Mass tort net claims paid were $72 million
in 2013. In 2013, ultimate loss estimates for asbestos and environmental claims were increased by $30 million. In addition to the
previously described methodologies, we consider “survival ratios” based on average net claim payments in recent years versus
net unpaid losses as a rough guide to reserve adequacy. The survival ratio based on claim payments made over the last three
years was approximately 15.6 years as of December 31, 2013. The reinsurance industry’s survival ratio for asbestos and
pollution reserves was approximately 14.5 years based on the three years ending December 31, 2012. Estimating mass tort
losses is very difficult due to the changing legal environment. Although such reserves are believed to be adequate, significant
reserve increases may be required in the future if new exposures or claimants are identified, new claims are reported or new
theories of liability emerge.
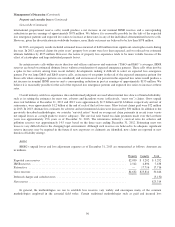
BHRG
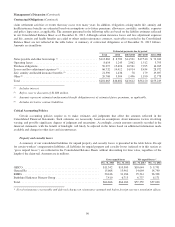
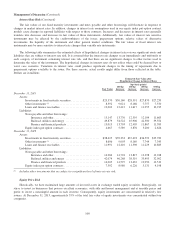
BHRG’s unpaid losses and loss adjustment expenses as of December 31, 2013 are summarized as follows. Amounts are
in millions.
Property Casualty Total
Reported case reserves ........................................................... $2,090 $ 3,202 $ 5,292
IBNR reserves .................................................................. 2,542 4,896 7,438
Retroactive .................................................................... — 17,716 17,716
Gross reserves .................................................................. $4,632 $25,814 30,446
Deferred charges and ceded reserves ................................................ (5,132)
Net reserves .................................................................... $25,314
In general, the methodologies we use to establish loss reserves vary widely and encompass many of the common
methodologies employed in the actuarial field today. Certain traditional methodologies such as paid and incurred loss
96