Berkshire Hathaway 2013 Annual Report Download - page 86
Download and view the complete annual report
Please find page 86 of the 2013 Berkshire Hathaway annual report below. You can navigate through the pages in the report by either clicking on the pages listed below, or by using the keyword search tool below to find specific information within the annual report.-
 1
1 -
2
-
3
-
4
-
5
-
6
-
7
-
8
-
9
-
10
-
11
-
12
-
13
-
14
-
15
-
16
-
17
-
18
-
19
-
20
-
21
-
22
-
23
-
24
-
25
-
26
-
27
-
28
-
29
-
30
-
31
-
32
-
33
-
34
-
35
-
36
-
37
-
38
-
39
-
40
-
41
-
42
-
43
-
44
-
45
-
46
-
47
-
48
-
49
-
50
-
51
-
52
-
53
-
54
-
55
-
56
-
57
-
58
-
59
-
60
-
61
-
62
-
63
-
64
-
65
-
66
-
67
-
68
-
69
-
70
-
71
-
72
-
73
-
74
-
75
-
 76
76 -
 77
77 -
 78
78 -
 79
79 -
 80
80 -
 81
81 -
 82
82 -
 83
83 -
 84
84 -
 85
85 -
 86
86 -
 87
87 -
 88
88 -
 89
89 -
 90
90 -
 91
91 -
 92
92 -
 93
93 -
 94
94 -
 95
95 -
 96
96 -
97
-
98
-
99
-
100
-
101
-
102
-
103
-
104
-
105
-
106
-
107
-
108
-
109
-
110
-
111
-
112
-
113
-
114
-
115
-
116
-
117
-
118
-
119
-
120
-
121
-
122
-
123
-
124
-
125
-
126
-
127
-
128
-
129
-
130
-
131
-
132
-
133
-
134
-
135
-
136
-
137
-
138
-
139
-
140
 |
 |

Management’s Discussion (Continued)
Manufacturing, Service and Retailing (Continued)
Other service (Continued)
(13%) compared to 2012. The increase in earnings was primarily attributable to BH Media, FlightSafety, TTI and NetJets. The
earnings increase of BH Media was due to bolt-on acquisitions during the last two years. TTI’s earnings increased 10% in 2013
versus 2012, due to higher sales and changes in product mix. TTI continues to be impacted by price competition, which
pressures overall gross sales margins. FlightSafety’s earnings increased 11% in 2013, reflecting increased training revenues and
relatively unchanged operating expenses. In 2013, NetJets’ earnings increased 7% as improved flight operations margins,
fractional sales margins and reduced net financing costs more than offset the increase in comparative aircraft value impairment
charges.
Revenues of our other service businesses in 2012 were approximately $8.2 billion, an increase of $737 million (10%) over
2011. The increase in revenues in 2012 was primarily attributable to the inclusion of the BH Media Group and a comparative
revenue increase from TTI, principally due to its bolt-on business acquisitions in 2012. Pre-tax earnings of $966 million in 2012
declined $11 million (1%) from earnings in 2011. Earnings of NetJets and FlightSafety in 2012 were relatively unchanged from
2011. Earnings of other service businesses in 2012 included earnings of the BH Media Group, which were more than offset by
lower earnings from TTI due primarily to weaker customer demand and intensifying price competition over the past year.
Retailing
Our retailing operations consist of four home furnishings businesses (Nebraska Furniture Mart, R.C. Willey, Star Furniture
and Jordan’s), three jewelry businesses (Borsheims, Helzberg and Ben Bridge), See’s Candies; Pampered Chef, a direct seller of
high quality kitchen tools; and Oriental Trading Company (“OTC”), a direct retailer of party supplies, school supplies and toys
and novelties, which we acquired on November 27, 2012.
Revenues of our retailing businesses in 2013 were $4.3 billion, an increase of $573 million (15%) over 2012. Pre-tax
earnings in 2013 of these businesses increased $70 million (23%) as compared to earnings in 2012. The comparative increases
in revenues and earnings were primarily attributable to the inclusion of OTC for the full year in 2013. Otherwise, earnings of the
home furnishings and jewelry retail groups increased in 2013, while earnings of Pampered Chef and See’s Candies declined.
Revenues and pre-tax earnings in 2012 from the retailing businesses increased $142 million (4%) and $5 million (2%),
respectively, over revenues and earnings in 2011. Increased revenues from the home furnishings and jewelry businesses as well
as the inclusion of OTC from its acquisition date were partially offset by lower revenues from Pampered Chef. Increased
earnings of our home furnishings retailers were substantially offset by lower earnings from our jewelry businesses and
Pampered Chef.
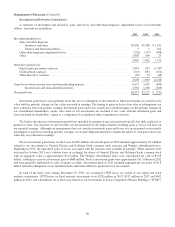
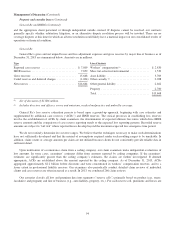
Finance and Financial Products
Our finance and financial products businesses include manufactured housing and finance (Clayton Homes), transportation
equipment leasing (XTRA), furniture leasing (CORT) as well as various miscellaneous financing activities. A summary of
revenues and earnings from our finance and financial products businesses follows. Amounts are in millions.
Revenues Earnings
2013 2012 2011 2013 2012 2011
Manufactured housing and finance .................................. $3,199 $3,014 $2,932 $416 $255 $154
Furniture/transportation equipment leasing ............................ 772 753 739 165 148 155
Other .......................................................... 320 343 343 404 445 465
$4,291 $4,110 $4,014
Pre-tax earnings ................................................. 985 848 774
Income taxes and noncontrolling interests ............................. 328 291 258
$657 $557 $516
84