Berkshire Hathaway 2013 Annual Report Download - page 67
Download and view the complete annual report
Please find page 67 of the 2013 Berkshire Hathaway annual report below. You can navigate through the pages in the report by either clicking on the pages listed below, or by using the keyword search tool below to find specific information within the annual report.-
 1
1 -
2
-
3
-
4
-
5
-
6
-
7
-
8
-
9
-
10
-
11
-
12
-
13
-
14
-
15
-
16
-
17
-
18
-
19
-
20
-
21
-
22
-
23
-
24
-
25
-
26
-
27
-
28
-
29
-
30
-
31
-
32
-
33
-
34
-
35
-
36
-
37
-
38
-
39
-
40
-
41
-
42
-
43
-
44
-
45
-
46
-
47
-
48
-
49
-
50
-
51
-
52
-
53
-
54
-
55
-
56
-
 57
57 -
 58
58 -
 59
59 -
 60
60 -
 61
61 -
 62
62 -
 63
63 -
 64
64 -
 65
65 -
 66
66 -
 67
67 -
 68
68 -
 69
69 -
 70
70 -
 71
71 -
 72
72 -
 73
73 -
 74
74 -
 75
75 -
 76
76 -
 77
77 -
78
-
79
-
80
-
81
-
82
-
83
-
84
-
85
-
86
-
87
-
88
-
89
-
90
-
91
-
92
-
93
-
94
-
95
-
96
-
97
-
98
-
99
-
100
-
101
-
102
-
103
-
104
-
105
-
106
-
107
-
108
-
109
-
110
-
111
-
112
-
113
-
114
-
115
-
116
-
117
-
118
-
119
-
120
-
121
-
122
-
123
-
124
-
125
-
126
-
127
-
128
-
129
-
130
-
131
-
132
-
133
-
134
-
135
-
136
-
137
-
138
-
139
-
140
 |
 |

Notes to Consolidated Financial Statements (Continued)
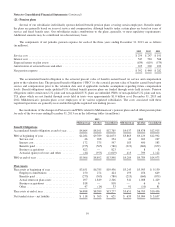
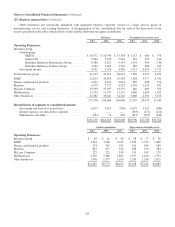
(23) Business segment data (Continued)
Goodwill
at year-end
Identifiable assets
at year-end
2013 2012 2013 2012 2011
Operating Businesses:
Insurance group:
GEICO ............................................... $ 1,372 $ 1,372 $ 39,568 $ 30,986 $ 27,253
General Re ............................................ 13,532 13,532 29,956 30,477 28,442
Berkshire Hathaway Reinsurance and Primary Groups .......... 607 607 138,480 118,819 104,913
Total insurance group ........................................ 15,511 15,511 208,004 180,282 160,608
BNSF .................................................... 14,819 14,836 59,842 56,839 55,282
Finance and financial products ................................. 1,036 1,036 25,163 24,412 23,919
Marmon .................................................. 800 814 11,767 11,230 10,597
McLane Company .......................................... 701 705 5,209 5,090 4,107
MidAmerican .............................................. 7,784 5,377 62,189 46,856 42,039
Other businesses ............................................ 16,360 16,244 39,107 36,875 34,994
$57,011 $54,523 411,281 361,584 331,546
Reconciliation of segments to consolidated amount:
Corporate and other ..................................... 16,639 11,345 7,888
Goodwill .............................................. 57,011 54,523 53,213
$484,931 $427,452 $392,647
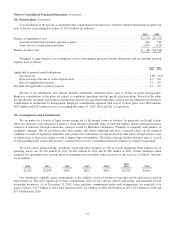
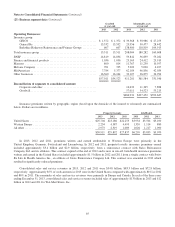
Insurance premiums written by geographic region (based upon the domicile of the insured or reinsured) are summarized
below. Dollars are in millions.
Property/Casualty Life/Health
2013 2012 2011 2013 2012 2011
United States ............................................ $25,704 $23,186 $22,253 $3,934 $3,504 $3,100
Western Europe .......................................... 2,234 4,387 4,495 1,339 1,114 880
All other ................................................ 2,973 2,319 1,089 1,026 1,217 1,090
$30,911 $29,892 $27,837 $6,299 $5,835 $5,070
In 2013, 2012 and 2011, premiums written and earned attributable to Western Europe were primarily in the
United Kingdom, Germany, Switzerland and Luxembourg. In 2012 and 2011, property/casualty insurance premiums earned
included approximately $3.4 billion and $2.9 billion, respectively, from a reinsurance contract with Swiss Reinsurance
Company Ltd. and its affiliates. This contract expired at the end of 2012 and is now in run-off. Life/health insurance premiums
written and earned in the United States included approximately $1.5 billion in 2012 and 2011 from a single contract with Swiss
Re Life & Health America Inc., an affiliate of Swiss Reinsurance Company Ltd. This contract was amended in 2013 which
resulted in significantly reduced premiums.
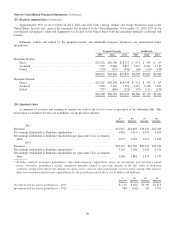
Consolidated sales and service revenues in 2013, 2012 and 2011 were $94.8 billion, $83.3 billion and $72.8 billion,
respectively. Approximately 85% of such amounts in 2013 were in the United States compared with approximately 84% in 2012
and 86% in 2011. The remainder of sales and service revenues were primarily in Europe and Canada. In each of the three years
ending December 31, 2013, consolidated sales and service revenues included sales of approximately $13 billion in 2013 and $12
billion in 2012 and 2011 to Wal-Mart Stores, Inc.
65