Berkshire Hathaway 2013 Annual Report Download - page 87
Download and view the complete annual report
Please find page 87 of the 2013 Berkshire Hathaway annual report below. You can navigate through the pages in the report by either clicking on the pages listed below, or by using the keyword search tool below to find specific information within the annual report.-
 1
1 -
2
-
3
-
4
-
5
-
6
-
7
-
8
-
9
-
10
-
11
-
12
-
13
-
14
-
15
-
16
-
17
-
18
-
19
-
20
-
21
-
22
-
23
-
24
-
25
-
26
-
27
-
28
-
29
-
30
-
31
-
32
-
33
-
34
-
35
-
36
-
37
-
38
-
39
-
40
-
41
-
42
-
43
-
44
-
45
-
46
-
47
-
48
-
49
-
50
-
51
-
52
-
53
-
54
-
55
-
56
-
57
-
58
-
59
-
60
-
61
-
62
-
63
-
64
-
65
-
66
-
67
-
68
-
69
-
70
-
71
-
72
-
73
-
74
-
75
-
76
-
 77
77 -
 78
78 -
 79
79 -
 80
80 -
 81
81 -
 82
82 -
 83
83 -
 84
84 -
 85
85 -
 86
86 -
 87
87 -
 88
88 -
 89
89 -
 90
90 -
 91
91 -
 92
92 -
 93
93 -
 94
94 -
 95
95 -
 96
96 -
 97
97 -
98
-
99
-
100
-
101
-
102
-
103
-
104
-
105
-
106
-
107
-
108
-
109
-
110
-
111
-
112
-
113
-
114
-
115
-
116
-
117
-
118
-
119
-
120
-
121
-
122
-
123
-
124
-
125
-
126
-
127
-
128
-
129
-
130
-
131
-
132
-
133
-
134
-
135
-
136
-
137
-
138
-
139
-
140
 |
 |
Management’s Discussion (Continued)
Finance and Financial Products (Continued)
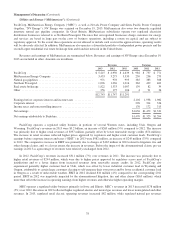
Clayton Homes’ revenues and pre-tax earnings in 2013 increased $185 million (6%) and $161 million (63%), respectively,
compared to 2012. In 2013, Clayton Homes’ pre-tax earnings benefitted from increased home sales, lower loan loss provisions
and an increase in net interest income, as lower interest expense more than offset reductions in interest income on loan
portfolios. Home unit sales increased 9% in 2013. Loan loss provisions in 2013 were lower reflecting comparatively lower
foreclosures volume and loss rates. Clayton Homes’ manufactured housing business continues to operate at a competitive
disadvantage compared to traditional single family housing markets, which receive significant interest rate subsidies from the
U.S. Government through government agency insured mortgages. For the most part, these subsidies are not available to factory
built homes. Nevertheless, Clayton Homes remains the largest manufactured housing business in the United States and we
believe that it will continue to operate profitably, even under the prevailing conditions.
Clayton Homes’ pre-tax earnings in 2012 increased $101 million (66%) over earnings in 2011. Earnings in 2012 were
impacted by the increased unit sales, which improved manufacturing and other operating efficiencies. Earnings also benefited
from reduced insurance claims and a decline in credit losses. The decline in interest income on loan portfolios was more than
offset by interest expense attributable to a decline in borrowings and lower interest rates.
Pre-tax earnings of CORT and XTRA in 2013 increased $17 million (11%) to $165 million, as compared to 2012. The
increase reflected increased lease revenues and earnings of XTRA, which benefitted from increases in working units and
average rental rates, relatively stable operating expenses and a foreign currency related gain in 2013.
Pre-tax earnings of CORT and XTRA in 2012 were $148 million, a decline of $7 million (5%) versus 2011. In 2012,
CORT’s earnings increased over 2011 due to a 5% increase in rental income and relatively stable selling, general and
administrative expenses, which improved operating margins. In 2012, earnings from XTRA declined primarily due to increased
depreciation expense and lower foreign currency exchange gains.
Other earnings include interest and dividends from a portfolio of fixed maturity and equity investments and our share of the
earnings of a commercial mortgage servicing business in which we own a 50% interest. Other earnings previously included
interest income from a relatively small number of long-held commercial real estate loans. These loans were repaid in full during
the third and fourth quarters of 2012. In addition, other earnings includes income from interest rate spreads charged to Clayton
Homes on borrowings by a Berkshire financing subsidiary that are used to fund loans to Clayton Homes and from guaranty fees
charged to NetJets. Corresponding expenses are included in Clayton Homes’ and NetJets’ results. Guaranty fees charged to
NetJets were $11 million in 2013, $30 million in 2012 and $41 million in 2011 and interest spreads charged to Clayton Homes
were $78 million in 2013, $90 million in 2012 and $100 million in 2011.
85