Berkshire Hathaway 2013 Annual Report Download - page 42
Download and view the complete annual report
Please find page 42 of the 2013 Berkshire Hathaway annual report below. You can navigate through the pages in the report by either clicking on the pages listed below, or by using the keyword search tool below to find specific information within the annual report.-
 1
1 -
2
-
3
-
4
-
5
-
6
-
7
-
8
-
9
-
10
-
11
-
12
-
13
-
14
-
15
-
16
-
17
-
18
-
19
-
20
-
21
-
22
-
23
-
24
-
25
-
26
-
27
-
28
-
29
-
30
-
31
-
 32
32 -
 33
33 -
 34
34 -
 35
35 -
 36
36 -
 37
37 -
 38
38 -
 39
39 -
 40
40 -
 41
41 -
 42
42 -
 43
43 -
 44
44 -
 45
45 -
 46
46 -
 47
47 -
 48
48 -
 49
49 -
 50
50 -
 51
51 -
 52
52 -
53
-
54
-
55
-
56
-
57
-
58
-
59
-
60
-
61
-
62
-
63
-
64
-
65
-
66
-
67
-
68
-
69
-
70
-
71
-
72
-
73
-
74
-
75
-
76
-
77
-
78
-
79
-
80
-
81
-
82
-
83
-
84
-
85
-
86
-
87
-
88
-
89
-
90
-
91
-
92
-
93
-
94
-
95
-
96
-
97
-
98
-
99
-
100
-
101
-
102
-
103
-
104
-
105
-
106
-
107
-
108
-
109
-
110
-
111
-
112
-
113
-
114
-
115
-
116
-
117
-
118
-
119
-
120
-
121
-
122
-
123
-
124
-
125
-
126
-
127
-
128
-
129
-
130
-
131
-
132
-
133
-
134
-
135
-
136
-
137
-
138
-
139
-
140
 |
 |

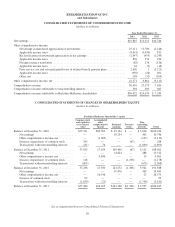
Notes to Consolidated Financial Statements (Continued)
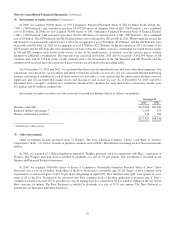
(2) Significant business acquisitions (Continued)
In 2012 and 2013, we also completed several smaller-sized business acquisitions, most of which were considered as “bolt-
on” acquisitions to several of our existing business operations. Aggregate consideration paid for business acquisitions for 2013
was approximately $1.1 billion and for 2012 was approximately $3.2 billion, which included $438 million for entities that will
develop, construct and subsequently operate renewable energy generation facilities. We do not believe that these acquisitions
were material, individually or in the aggregate, to our Consolidated Financial Statements.
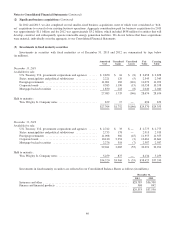
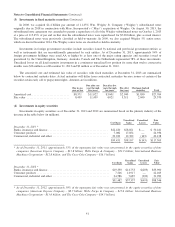
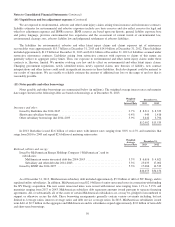
(3) Investments in fixed maturity securities
Investments in securities with fixed maturities as of December 31, 2013 and 2012 are summarized by type below
(in millions).
Amortized
Cost
Unrealized
Gains
Unrealized
Losses
Fair
Value
Carrying
Value
December 31, 2013
Available for sale:
U.S. Treasury, U.S. government corporations and agencies ...... $ 2,650 $ 16 $ (8) $ 2,658 $ 2,658
States, municipalities and political subdivisions ............... 2,221 129 (5) 2,345 2,345
Foreign governments .................................... 11,001 182 (110) 11,073 11,073
Corporate bonds ........................................ 9,383 1,190 (15) 10,558 10,558
Mortgage-backed securities ............................... 1,830 218 (8) 2,040 2,040
27,085 1,735 (146) 28,674 28,674
Held to maturity:
Wm. Wrigley Jr. Company notes ........................... 679 17 — 696 679
$27,764 $1,752 $(146) $29,370 $29,353
December 31, 2012
Available for sale:
U.S. Treasury, U.S. government corporations and agencies ...... $ 2,742 $ 33 $ — $ 2,775 $ 2,775
States, municipalities and political subdivisions ............... 2,735 178 — 2,913 2,913
Foreign governments .................................... 11,098 302 (45) 11,355 11,355
Corporate bonds ........................................ 10,410 2,254 (3) 12,661 12,661
Mortgage-backed securities ............................... 2,276 318 (7) 2,587 2,587
29,261 3,085 (55) 32,291 32,291
Held to maturity:
Wm. Wrigley Jr. Company notes ........................... 5,259 875 — 6,134 5,259
$34,520 $3,960 $ (55) $38,425 $37,550
Investments in fixed maturity securities are reflected in our Consolidated Balance Sheets as follows (in millions).
December 31,
2013 2012
Insurance and other ............................................................ $28,785 $36,708
Finance and financial products ................................................... 568 842
$29,353 $37,550
40