Berkshire Hathaway 2013 Annual Report Download - page 72
Download and view the complete annual report
Please find page 72 of the 2013 Berkshire Hathaway annual report below. You can navigate through the pages in the report by either clicking on the pages listed below, or by using the keyword search tool below to find specific information within the annual report.-
 1
1 -
2
-
3
-
4
-
5
-
6
-
7
-
8
-
9
-
10
-
11
-
12
-
13
-
14
-
15
-
16
-
17
-
18
-
19
-
20
-
21
-
22
-
23
-
24
-
25
-
26
-
27
-
28
-
29
-
30
-
31
-
32
-
33
-
34
-
35
-
36
-
37
-
38
-
39
-
40
-
41
-
42
-
43
-
44
-
45
-
46
-
47
-
48
-
49
-
50
-
51
-
52
-
53
-
54
-
55
-
56
-
57
-
58
-
59
-
60
-
61
-
 62
62 -
 63
63 -
 64
64 -
 65
65 -
 66
66 -
 67
67 -
 68
68 -
 69
69 -
 70
70 -
 71
71 -
 72
72 -
 73
73 -
 74
74 -
 75
75 -
 76
76 -
 77
77 -
 78
78 -
 79
79 -
 80
80 -
 81
81 -
 82
82 -
83
-
84
-
85
-
86
-
87
-
88
-
89
-
90
-
91
-
92
-
93
-
94
-
95
-
96
-
97
-
98
-
99
-
100
-
101
-
102
-
103
-
104
-
105
-
106
-
107
-
108
-
109
-
110
-
111
-
112
-
113
-
114
-
115
-
116
-
117
-
118
-
119
-
120
-
121
-
122
-
123
-
124
-
125
-
126
-
127
-
128
-
129
-
130
-
131
-
132
-
133
-
134
-
135
-
136
-
137
-
138
-
139
-
140
 |
 |

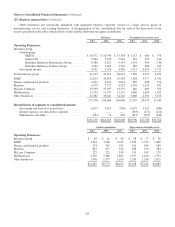
Management’s Discussion (Continued)
Insurance—Underwriting (Continued)
GEICO (Continued)
underwriting costs that are capitalized and expensed as premiums are earned over the policy period. The new accounting
standard, which we adopted on a prospective basis as of January 1, 2012, accelerates the timing of when certain underwriting
costs are recognized in earnings. We estimate that GEICO’s underwriting expenses in 2012 would have been about $410 million
less had we computed DPAC under the prior accounting standard. The effect of transitioning to this new accounting standard
was completed in 2012. Excluding the effects of the accounting change in 2012, the ratio of underwriting expenses to premiums
earned (the “expense ratio”) in 2013 declined by approximately 0.4 percentage points from 2012.
Premiums earned in 2012 were approximately $16.7 billion, an increase of $1.4 billion (9.0%) over 2011. The growth in
premiums earned for voluntary auto was 9.0% as a result of a 6.5% increase in policies-in-force and an increase in average
premium per policy as compared to 2011. Voluntary auto new business sales in 2012 increased slightly compared with 2011.
Voluntary auto policies-in-force at December 31, 2012 were approximately 704,000 greater than at December 31, 2011.
Losses and loss adjustment expenses incurred in 2012 were $12.7 billion, an increase of $687 million (5.7%) over 2011.
The loss ratio was 75.9% in 2012 and 78.2% in 2011. Losses and loss adjustment expenses in 2012 included $490 million
related to Hurricane Sandy. With the exception of Hurricane Sandy, GEICO’s catastrophe losses tend to occur regularly and are
normally not individually significant in amount.
Despite the losses from Hurricane Sandy, our loss ratio declined in 2012 as compared to 2011. Claims frequencies for
property damage and collision coverages were down about one percent, comprehensive coverage frequencies were down about
ten percent, excluding Hurricane Sandy, and frequencies for bodily injury coverages were relatively unchanged. Physical
damage severities increased in the two to four percent range and bodily injury severities increased in the one to three percent
range from 2011.
Underwriting expenses incurred in 2012 increased $586 million (21.1%) compared with 2011. The increase was primarily
the result of the change in U.S. GAAP concerning DPAC discussed previously. We estimate that GEICO’s underwriting
expenses in 2012 would have been about $410 million less had we computed DPAC under the prior accounting standard. Based
on that estimate, GEICO’s expense ratio in 2012 would have been less than in 2011.
General Re
Through General Re, we conduct a reinsurance business offering property and casualty and life and health coverages to
clients worldwide. We write property and casualty reinsurance in North America on a direct basis through General Reinsurance
Corporation and internationally through Germany-based General Reinsurance AG and other wholly-owned affiliates. Property
and casualty reinsurance is also written in broker markets through Faraday in London. Life and health reinsurance is written in
North America through General Re Life Corporation and internationally through General Reinsurance AG. General Re strives to
generate underwriting profits in essentially all of its product lines. Our management does not evaluate underwriting performance
based upon market share and our underwriters are instructed to reject inadequately priced risks. General Re’s underwriting
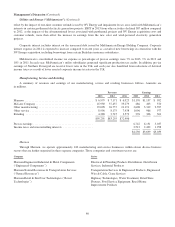
results are summarized in the following table. Amounts are in millions.
Premiums written Premiums earned Pre-tax underwriting gain (loss)
2013 2012 2011 2013 2012 2011 2013 2012 2011
Property/casualty ................ $2,972 $2,982 $2,910 $3,007 $2,904 $2,941 $148 $399 $ 7
Life/health ...................... 2,991 3,002 2,909 2,977 2,966 2,875 135 (44) 137
$5,963 $5,984 $5,819 $5,984 $5,870 $5,816 $283 $355 $144
70