Berkshire Hathaway 2013 Annual Report Download - page 103
Download and view the complete annual report
Please find page 103 of the 2013 Berkshire Hathaway annual report below. You can navigate through the pages in the report by either clicking on the pages listed below, or by using the keyword search tool below to find specific information within the annual report.-
 1
1 -
2
-
3
-
4
-
5
-
6
-
7
-
8
-
9
-
10
-
11
-
12
-
13
-
14
-
15
-
16
-
17
-
18
-
19
-
20
-
21
-
22
-
23
-
24
-
25
-
26
-
27
-
28
-
29
-
30
-
31
-
32
-
33
-
34
-
35
-
36
-
37
-
38
-
39
-
40
-
41
-
42
-
43
-
44
-
45
-
46
-
47
-
48
-
49
-
50
-
51
-
52
-
53
-
54
-
55
-
56
-
57
-
58
-
59
-
60
-
61
-
62
-
63
-
64
-
65
-
66
-
67
-
68
-
69
-
70
-
71
-
72
-
73
-
74
-
75
-
76
-
77
-
78
-
79
-
80
-
81
-
82
-
83
-
84
-
85
-
86
-
87
-
88
-
89
-
90
-
91
-
92
-
 93
93 -
 94
94 -
 95
95 -
 96
96 -
 97
97 -
 98
98 -
 99
99 -
 100
100 -
 101
101 -
 102
102 -
 103
103 -
 104
104 -
 105
105 -
 106
106 -
 107
107 -
 108
108 -
 109
109 -
 110
110 -
 111
111 -
 112
112 -
 113
113 -
114
-
115
-
116
-
117
-
118
-
119
-
120
-
121
-
122
-
123
-
124
-
125
-
126
-
127
-
128
-
129
-
130
-
131
-
132
-
133
-
134
-
135
-
136
-
137
-
138
-
139
-
140
 |
 |

Management’s Discussion (Continued)
Equity Price Risk (Continued)
We often hold equity investments for long periods of time so we are not troubled by short-term price volatility with respect
to our investments provided that the underlying business, economic and management characteristics of the investees remain
favorable. We strive to maintain above average levels of shareholder capital to provide a margin of safety against short-term
price volatility.
Market prices for equity securities are subject to fluctuation and consequently the amount realized in the subsequent sale of
an investment may significantly differ from the reported market value. Fluctuation in the market price of a security may result
from perceived changes in the underlying economic characteristics of the investee, the relative price of alternative investments
and general market conditions.
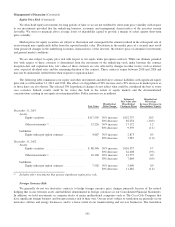
We are also subject to equity price risk with respect to our equity index put option contracts. While our ultimate potential
loss with respect to these contracts is determined from the movement of the underlying stock index between the contract
inception date and expiration date, fair values of these contracts are also affected by changes in other factors such as interest
rates, expected dividend rates and the remaining duration of the contract. These contracts expire between 2018 and 2026 and
may not be unilaterally settled before their respective expiration dates.
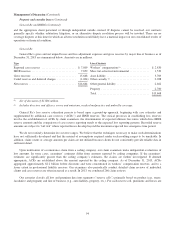
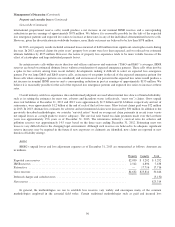
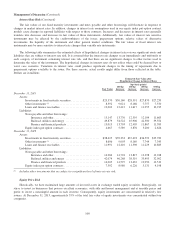
The following table summarizes our equity and other investments and derivative contract liabilities with significant equity
price risk as of December 31, 2013 and 2012. The effects of a hypothetical 30% increase and a 30% decrease in market prices as
of those dates are also shown. The selected 30% hypothetical changes do not reflect what could be considered the best or worst
case scenarios. Indeed, results could be far worse due both to the nature of equity markets and the aforementioned
concentrations existing in our equity investment portfolio. Dollar amounts are in millions.
Fair Value
Hypothetical
Price Change
Estimated
Fair Value after
Hypothetical
Change in Prices
Hypothetical
Percentage
Increase (Decrease) in
Shareholders’ Equity
December 31, 2013
Assets:
Equity securities ............................ $117,505 30% increase $152,757 10.3
30% decrease 82,254 (10.3)
Other investments (1) ......................... 13,226 30% increase 17,172 1.2
30% decrease 9,359 (1.1)
Liabilities:
Equity index put option contracts ............... 4,667 30% increase 2,873 0.5
30% decrease 7,987 (1.0)
December 31, 2012
Assets:
Equity securities ............................ $ 88,346 30% increase $116,357 9.7
30% decrease 61,408 (9.3)
Other investments (1) ......................... 10,136 30% increase 12,775 0.9
30% decrease 7,664 (0.9)
Liabilities:
Equity index put option contracts ............... 7,502 30% increase 5,009 0.9
30% decrease 11,482 (1.4)
(1) Includes other investments that possess significant equity price risk.
Foreign Currency Risk
We generally do not use derivative contracts to hedge foreign currency price changes primarily because of the natural
hedging that occurs between assets and liabilities denominated in foreign currencies in our Consolidated Financial Statements.
In addition, we hold investments in common stocks of major multinational companies such as The Coca-Cola Company that
have significant foreign business and foreign currency risk of their own. Our net assets subject to translation are primarily in our
insurance, utilities and energy businesses, and to a lesser extent in our manufacturing and services businesses. The translation
101