Berkshire Hathaway 2013 Annual Report Download - page 30
Download and view the complete annual report
Please find page 30 of the 2013 Berkshire Hathaway annual report below. You can navigate through the pages in the report by either clicking on the pages listed below, or by using the keyword search tool below to find specific information within the annual report.-
 1
1 -
2
-
3
-
4
-
5
-
6
-
7
-
8
-
9
-
10
-
11
-
12
-
13
-
14
-
15
-
16
-
17
-
18
-
19
-
 20
20 -
 21
21 -
 22
22 -
 23
23 -
 24
24 -
 25
25 -
 26
26 -
 27
27 -
 28
28 -
 29
29 -
 30
30 -
 31
31 -
 32
32 -
 33
33 -
 34
34 -
 35
35 -
 36
36 -
 37
37 -
 38
38 -
 39
39 -
 40
40 -
41
-
42
-
43
-
44
-
45
-
46
-
47
-
48
-
49
-
50
-
51
-
52
-
53
-
54
-
55
-
56
-
57
-
58
-
59
-
60
-
61
-
62
-
63
-
64
-
65
-
66
-
67
-
68
-
69
-
70
-
71
-
72
-
73
-
74
-
75
-
76
-
77
-
78
-
79
-
80
-
81
-
82
-
83
-
84
-
85
-
86
-
87
-
88
-
89
-
90
-
91
-
92
-
93
-
94
-
95
-
96
-
97
-
98
-
99
-
100
-
101
-
102
-
103
-
104
-
105
-
106
-
107
-
108
-
109
-
110
-
111
-
112
-
113
-
114
-
115
-
116
-
117
-
118
-
119
-
120
-
121
-
122
-
123
-
124
-
125
-
126
-
127
-
128
-
129
-
130
-
131
-
132
-
133
-
134
-
135
-
136
-
137
-
138
-
139
-
140
 |
 |

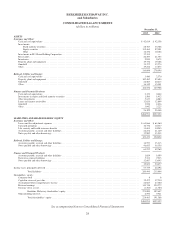
BERKSHIRE HATHAWAY INC.
and Subsidiaries
CONSOLIDATED BALANCE SHEETS
(dollars in millions)
December 31,
2013 2012
ASSETS
Insurance and Other:
Cash and cash equivalents ................................................................................... $ 42,614 $ 42,358
Investments:
Fixed maturity securities ................................................................................. 28,785 36,708
Equity securities ....................................................................................... 115,464 87,081
Other ................................................................................................ 12,334 10,184
Investments in H.J. Heinz Holding Corporation ................................................................... 12,111 —
Receivables ............................................................................................... 20,497 21,753
Inventories ................................................................................................ 9,945 9,675
Property, plant and equipment ................................................................................ 19,732 19,188
Goodwill ................................................................................................. 33,372 33,274
Other .................................................................................................... 19,244 17,875
314,098 278,096
Railroad, Utilities and Energy:
Cash and cash equivalents ................................................................................... 3,400 2,570
Property, plant and equipment ................................................................................ 102,482 87,684
Goodwill ................................................................................................. 22,603 20,213
Other .................................................................................................... 16,149 13,441
144,634 123,908
Finance and Financial Products:
Cash and cash equivalents ................................................................................... 2,172 2,064
Investments in equity and fixed maturity securities ................................................................ 1,506 1,432
Other investments .......................................................................................... 5,617 4,882
Loans and finance receivables ................................................................................ 12,826 12,809
Goodwill ................................................................................................. 1,036 1,036
Other .................................................................................................... 3,042 3,225
26,199 25,448
$484,931 $427,452
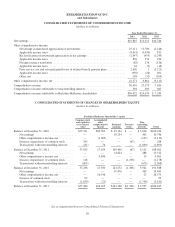
LIABILITIES AND SHAREHOLDERS’ EQUITY
Insurance and Other:
Losses and loss adjustment expenses ........................................................................... $ 64,866 $ 64,160
Unearned premiums ........................................................................................ 10,770 10,237
Life, annuity and health insurance benefits ...................................................................... 11,681 10,943
Accounts payable, accruals and other liabilities ................................................................... 22,254 21,149
Notes payable and other borrowings ............................................................................ 12,902 13,535
122,473 120,024
Railroad, Utilities and Energy:
Accounts payable, accruals and other liabilities ................................................................... 14,557 13,113
Notes payable and other borrowings ............................................................................ 46,655 36,156
61,212 49,269
Finance and Financial Products:
Accounts payable, accruals and other liabilities ................................................................... 1,024 1,099
Derivative contract liabilities ................................................................................. 5,331 7,933
Notes payable and other borrowings ............................................................................ 12,667 13,045
19,022 22,077
Income taxes, principally deferred ................................................................................. 57,739 44,494
Total liabilities .................................................................................... 260,446 235,864
Shareholders’ equity:
Common stock ............................................................................................ 8 8
Capital in excess of par value ................................................................................. 35,472 37,230
Accumulated other comprehensive income ...................................................................... 44,025 27,500
Retained earnings .......................................................................................... 143,748 124,272
Treasury stock, at cost ....................................................................................... (1,363) (1,363)
Berkshire Hathaway shareholders’ equity ............................................................... 221,890 187,647
Noncontrolling interests ..................................................................................... 2,595 3,941
Total shareholders’ equity ............................................................................ 224,485 191,588
$484,931 $427,452
See accompanying Notes to Consolidated Financial Statements
28