Berkshire Hathaway 2013 Annual Report Download - page 9
Download and view the complete annual report
Please find page 9 of the 2013 Berkshire Hathaway annual report below. You can navigate through the pages in the report by either clicking on the pages listed below, or by using the keyword search tool below to find specific information within the annual report.-
 1
1 -
 2
2 -
 3
3 -
 4
4 -
 5
5 -
 6
6 -
 7
7 -
 8
8 -
 9
9 -
 10
10 -
 11
11 -
 12
12 -
 13
13 -
 14
14 -
 15
15 -
 16
16 -
 17
17 -
 18
18 -
 19
19 -
 20
20 -
21
-
22
-
23
-
24
-
25
-
26
-
27
-
28
-
29
-
30
-
31
-
32
-
33
-
34
-
35
-
36
-
37
-
38
-
39
-
40
-
41
-
42
-
43
-
44
-
45
-
46
-
47
-
48
-
49
-
50
-
51
-
52
-
53
-
54
-
55
-
56
-
57
-
58
-
59
-
60
-
61
-
62
-
63
-
64
-
65
-
66
-
67
-
68
-
69
-
70
-
71
-
72
-
73
-
74
-
75
-
76
-
77
-
78
-
79
-
80
-
81
-
82
-
83
-
84
-
85
-
86
-
87
-
88
-
89
-
90
-
91
-
92
-
93
-
94
-
95
-
96
-
97
-
98
-
99
-
100
-
101
-
102
-
103
-
104
-
105
-
106
-
107
-
108
-
109
-
110
-
111
-
112
-
113
-
114
-
115
-
116
-
117
-
118
-
119
-
120
-
121
-
122
-
123
-
124
-
125
-
126
-
127
-
128
-
129
-
130
-
131
-
132
-
133
-
134
-
135
-
136
-
137
-
138
-
139
-
140
 |
 |

Intrinsic Business Value
As much as Charlie and I talk about intrinsic business value, we cannot tell you precisely what that
number is for Berkshire shares (nor, in fact, for any other stock). In our 2010 annual report, however, we laid out
the three elements – one of them qualitative – that we believe are the keys to a sensible estimate of Berkshire’s
intrinsic value. That discussion is reproduced in full on pages 109 - 110.
Here is an update of the two quantitative factors: In 2013 our per-share investments increased 13.6% to
$129,253 and our pre-tax earnings from businesses other than insurance and investments increased 12.8% to $9,116
per share.
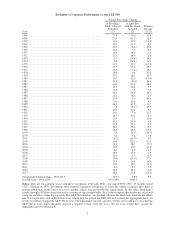
Since 1970, our per-share investments have increased at a rate of 19.3% compounded annually, and our
earnings figure has grown at a 20.6% clip. It is no coincidence that the price of Berkshire stock over the 43-year
period has increased at a rate very similar to that of our two measures of value. Charlie and I like to see gains in
both sectors, but we will most strongly focus on building operating earnings.
************
Now, let’s examine the four major sectors of our operations. Each has vastly different balance sheet and
income characteristics from the others. So we’ll present them as four separate businesses, which is how Charlie and
I view them (though there are important and enduring advantages to having them all under one roof). Our goal is to
provide you with the information we would wish to have if our positions were reversed, with you being the
reporting manager and we the absentee shareholders. (But don’t get any ideas!)
Insurance
“Our investment in the insurance companies reflects a first major step in our efforts to achieve a more
diversified base of earning power.”
— 1967 Annual Report
Let’s look first at insurance, Berkshire’s core operation and the engine that has consistently propelled our
expansion since that 1967 report was published.
Property-casualty (“P/C”) insurers receive premiums upfront and pay claims later. In extreme cases, such
as those arising from certain workers’ compensation accidents, payments can stretch over decades. This collect-
now, pay-later model leaves P/C companies holding large sums – money we call “float” – that will eventually go to
others. Meanwhile, insurers get to invest this float for their benefit. Though individual policies and claims come
and go, the amount of float an insurer holds usually remains fairly stable in relation to premium volume.
Consequently, as our business grows, so does our float. And how we have grown, as the following table shows:
Year Float (in $ millions)
1970 $ 39
1980 237
1990 1,632
2000 27,871
2010 65,832
2013 77,240
Further gains in float will be tough to achieve. On the plus side, GEICO’s float will almost certainly grow.
In National Indemnity’s reinsurance division, however, we have a number of run-off contracts whose float drifts
downward. If we do experience a decline in float at some future time, it will be very gradual – at the outside no
more than 3% in any year. The nature of our insurance contracts is such that we can never be subject to immediate
demands for sums that are large compared to our cash resources. (In this respect, property-casualty insurance
differs in an important way from certain forms of life insurance.)
7