Berkshire Hathaway 2013 Annual Report Download - page 43
Download and view the complete annual report
Please find page 43 of the 2013 Berkshire Hathaway annual report below. You can navigate through the pages in the report by either clicking on the pages listed below, or by using the keyword search tool below to find specific information within the annual report.-
 1
1 -
2
-
3
-
4
-
5
-
6
-
7
-
8
-
9
-
10
-
11
-
12
-
13
-
14
-
15
-
16
-
17
-
18
-
19
-
20
-
21
-
22
-
23
-
24
-
25
-
26
-
27
-
28
-
29
-
30
-
31
-
32
-
 33
33 -
 34
34 -
 35
35 -
 36
36 -
 37
37 -
 38
38 -
 39
39 -
 40
40 -
 41
41 -
 42
42 -
 43
43 -
 44
44 -
 45
45 -
 46
46 -
 47
47 -
 48
48 -
 49
49 -
 50
50 -
 51
51 -
 52
52 -
 53
53 -
54
-
55
-
56
-
57
-
58
-
59
-
60
-
61
-
62
-
63
-
64
-
65
-
66
-
67
-
68
-
69
-
70
-
71
-
72
-
73
-
74
-
75
-
76
-
77
-
78
-
79
-
80
-
81
-
82
-
83
-
84
-
85
-
86
-
87
-
88
-
89
-
90
-
91
-
92
-
93
-
94
-
95
-
96
-
97
-
98
-
99
-
100
-
101
-
102
-
103
-
104
-
105
-
106
-
107
-
108
-
109
-
110
-
111
-
112
-
113
-
114
-
115
-
116
-
117
-
118
-
119
-
120
-
121
-
122
-
123
-
124
-
125
-
126
-
127
-
128
-
129
-
130
-
131
-
132
-
133
-
134
-
135
-
136
-
137
-
138
-
139
-
140
 |
 |

Notes to Consolidated Financial Statements (Continued)
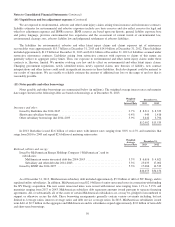
(3) Investments in fixed maturity securities (Continued)
In 2008, we acquired $4.4 billion par amount of 11.45% Wm. Wrigley Jr. Company (“Wrigley”) subordinated notes
originally due in 2018 in conjunction with Mars, Incorporated’s (“Mars”) acquisition of Wrigley. On August 30, 2013, the
subordinated note agreement was amended to permit a repurchase of all of the Wrigley subordinated notes on October 1, 2013
at a price of 115.45% of par and on that date the subordinated notes were repurchased for $5.08 billion, plus accrued interest.
The subordinated notes were previously classified as held-to-maturity. In 2009, we also acquired Wrigley 5% senior notes,
which are due in December 2014. The Wrigley senior notes are classified as held-to-maturity.
Investments in foreign government securities include securities issued by national and provincial government entities as
well as instruments that are unconditionally guaranteed by such entities. As of December 31, 2013, approximately 94% of
foreign government holdings were rated AA or higher by at least one of the major rating agencies and securities issued or
guaranteed by the United Kingdom, Germany, Australia, Canada and The Netherlands represented 78% of these investments.
Unrealized losses on all fixed maturity investments in a continuous unrealized loss position for more than twelve consecutive
months were $26 million as of December 31, 2013 and $9 million as of December 31, 2012.
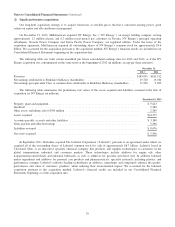
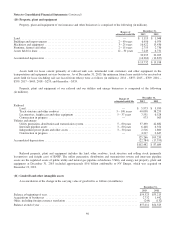
The amortized cost and estimated fair value of securities with fixed maturities at December 31, 2013 are summarized
below by contractual maturity dates. Actual maturities will differ from contractual maturities because issuers of certain of the
securities retain early call or prepayment rights. Amounts are in millions.
Due in one
year or less
Due after one
year through
five years
Due after five
years through
ten years
Due after
ten years
Mortgage-backed
securities Total
Amortized cost .......................... $8,371 $11,022 $3,601 $2,940 $1,830 $27,764
Fair value .............................. 8,499 11,499 4,021 3,311 2,040 29,370
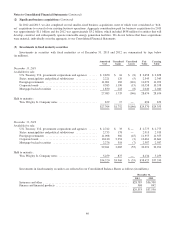
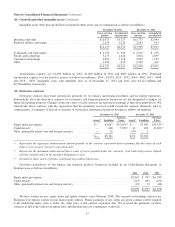
(4) Investments in equity securities
Investments in equity securities as of December 31, 2013 and 2012 are summarized based on the primary industry of the
investee in the table below (in millions).
Cost Basis
Unrealized
Gains
Unrealized
Losses
Fair
Value
December 31, 2013 *
Banks, insurance and finance .......................................... $22,420 $28,021 $ — $ 50,441
Consumer products .................................................. 7,082 17,854 — 24,936
Commercial, industrial and other ....................................... 29,949 12,322 (143) 42,128
$59,451 $58,197 $(143) $117,505
* As of December 31, 2013, approximately 55% of the aggregate fair value was concentrated in the equity securities of four
companies (American Express Company – $13.8 billion; Wells Fargo & Company – $21.9 billion; International Business
Machines Corporation – $12.8 billion; and The Coca-Cola Company – $16.5 billion).
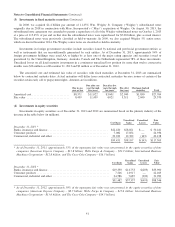
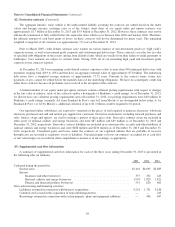
Cost Basis
Unrealized
Gains
Unrealized
Losses
Fair
Value
December 31, 2012 *
Banks, insurance and finance ........................................... $19,350 $14,753 $(203) $33,900
Consumer products ................................................... 7,546 14,917 — 22,463
Commercial, industrial and other ........................................ 24,586 7,687 (290) 31,983
$51,482 $37,357 $(493) $88,346
* As of December 31, 2012, approximately 59% of the aggregate fair value was concentrated in the equity securities of four
companies (American Express Company – $8.7 billion; Wells Fargo & Company – $15.6 billion; International Business
Machines Corporation – $13.0 billion; and The Coca-Cola Company – $14.5 billion).
41