Berkshire Hathaway 2013 Annual Report Download - page 79
Download and view the complete annual report
Please find page 79 of the 2013 Berkshire Hathaway annual report below. You can navigate through the pages in the report by either clicking on the pages listed below, or by using the keyword search tool below to find specific information within the annual report.-
 1
1 -
2
-
3
-
4
-
5
-
6
-
7
-
8
-
9
-
10
-
11
-
12
-
13
-
14
-
15
-
16
-
17
-
18
-
19
-
20
-
21
-
22
-
23
-
24
-
25
-
26
-
27
-
28
-
29
-
30
-
31
-
32
-
33
-
34
-
35
-
36
-
37
-
38
-
39
-
40
-
41
-
42
-
43
-
44
-
45
-
46
-
47
-
48
-
49
-
50
-
51
-
52
-
53
-
54
-
55
-
56
-
57
-
58
-
59
-
60
-
61
-
62
-
63
-
64
-
65
-
66
-
67
-
68
-
 69
69 -
 70
70 -
 71
71 -
 72
72 -
 73
73 -
 74
74 -
 75
75 -
 76
76 -
 77
77 -
 78
78 -
 79
79 -
 80
80 -
 81
81 -
 82
82 -
 83
83 -
 84
84 -
 85
85 -
 86
86 -
 87
87 -
 88
88 -
 89
89 -
90
-
91
-
92
-
93
-
94
-
95
-
96
-
97
-
98
-
99
-
100
-
101
-
102
-
103
-
104
-
105
-
106
-
107
-
108
-
109
-
110
-
111
-
112
-
113
-
114
-
115
-
116
-
117
-
118
-
119
-
120
-
121
-
122
-
123
-
124
-
125
-
126
-
127
-
128
-
129
-
130
-
131
-
132
-
133
-
134
-
135
-
136
-
137
-
138
-
139
-
140
 |
 |
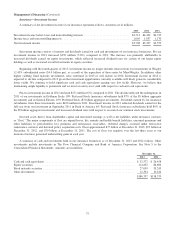
Management’s Discussion (Continued)
Railroad (“Burlington Northern Santa Fe”) (Continued)
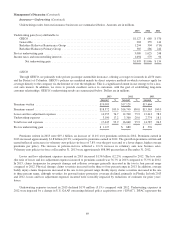
of 6% over 2012 that was primarily attributable to volume increases from domestic intermodal business and higher export
demand. Coal revenues were $5.0 billion in 2013, an increase of 2.6% over 2012, which was attributable to increased volume.
The volume increase reflected increased coal demand as a result of higher natural gas prices and reduced utility stockpiles,
partially offset by severe weather issues impacting service levels. In 2013, agricultural products revenues of $3.6 billion
declined 4% versus 2012 due to volume declines, which were mainly attributable to lower grain exports as a result of the
drought conditions in the U.S. in 2012 and strong global competition.
Revenues (and revenues per car/unit) in each period include fuel surcharges to customers under programs intended to
recover incremental fuel costs when fuel prices exceed threshold fuel prices. Surcharges vary by product/commodity, and
therefore amounts earned in a given period are impacted by business mix and volume as well as fuel costs. Fuel surcharges
increased 3% in 2013 as compared to 2012.
Operating expenses in 2013 were approximately $15.4 billion, an increase of $522 million (3.5%) compared to 2012.
Compensation and benefits expenses in 2013 increased $146 million (3.2%) in 2013 as compared to 2012, reflecting volume-
related cost increases and wage inflation. In 2013, fuel expenses increased $44 million (1%) versus 2012, as the impact of
higher volume was partially offset by lower average fuel prices. Purchased services expenses in 2013 increased 2% versus 2012,
due primarily to volume-related costs, including purchased transportation for BNSF Logistics LLC, a wholly-owned, third-party
logistics business. In 2013, equipment rents, materials and other expenses increased $204 million (13%) over 2012. The
increase was primarily due to higher property taxes, crew travel costs, derailment-related costs and locomotive material
expenses in 2013. Interest expense in 2013 increased $106 million (17%) compared to 2012 due to higher average outstanding
debt balances.
Revenues in 2012 were approximately $20.8 billion, an increase of $1.3 billion (7%) over 2011. Overall, the revenue
increase in 2012 reflected higher average revenues per car/unit of approximately 4% as well as a 2% increase in cars/units
handled (“volume”). Revenues in each period include fuel surcharges to customers under programs intended to recover
incremental fuel costs when fuel prices exceed threshold fuel prices. Fuel surcharges in 2012 increased 6% over 2011, and are
reflected in average revenue per car/unit.
The increase in overall volume during 2012 included increases in consumer products (4%) and industrial products (13%),
partially offset by declines in coal (6%) and agricultural products (3%). The consumer products volume increase was primarily
attributable to higher domestic intermodal and automotive volume. Industrial products volume increased primarily as a result of
increased shipments of petroleum and construction products. The decline in coal unit volume in 2012 was attributed to lower
coal demand as a result of low natural gas prices and high utility stockpiles. Agricultural product volume declined in 2012
compared to 2011, reflecting lower wheat and corn shipments for export partially offset by higher soybean and U.S. corn
shipments.
Operating expenses in 2012 increased $588 million (4%) compared to 2011. Compensation and benefits expenses in 2012
increased $190 million (4%) over 2011 due to the increased volume as well as wage inflation, partially offset by increased
productivity and lower weather-related costs. Fuel expenses in 2012 increased $192 million (4.5%) due to higher fuel prices and
increased volume, partially offset by improved fuel efficiency. Fuel efficiency in 2011 was negatively impacted by severe
weather conditions. Purchased services costs in 2012 increased $156 million (7%) compared to 2011 due primarily to increased
volume, increased purchased transportation services of BNSF Logistics and increased equipment maintenance costs, partially
offset by lower weather-related costs. Interest expense in 2012 increased $63 million (11%) versus 2011, due principally to
higher average outstanding debt balances.
Utilities and Energy (“MidAmerican”)
We hold an 89.8% ownership interest in MidAmerican Energy Holdings Company (“MidAmerican”), which operates an
international energy business. MidAmerican’s domestic regulated utility interests are currently comprised of four companies,
77