Berkshire Hathaway 2013 Annual Report Download - page 69
Download and view the complete annual report
Please find page 69 of the 2013 Berkshire Hathaway annual report below. You can navigate through the pages in the report by either clicking on the pages listed below, or by using the keyword search tool below to find specific information within the annual report.-
 1
1 -
2
-
3
-
4
-
5
-
6
-
7
-
8
-
9
-
10
-
11
-
12
-
13
-
14
-
15
-
16
-
17
-
18
-
19
-
20
-
21
-
22
-
23
-
24
-
25
-
26
-
27
-
28
-
29
-
30
-
31
-
32
-
33
-
34
-
35
-
36
-
37
-
38
-
39
-
40
-
41
-
42
-
43
-
44
-
45
-
46
-
47
-
48
-
49
-
50
-
51
-
52
-
53
-
54
-
55
-
56
-
57
-
58
-
 59
59 -
 60
60 -
 61
61 -
 62
62 -
 63
63 -
 64
64 -
 65
65 -
 66
66 -
 67
67 -
 68
68 -
 69
69 -
 70
70 -
 71
71 -
 72
72 -
 73
73 -
 74
74 -
 75
75 -
 76
76 -
 77
77 -
 78
78 -
 79
79 -
80
-
81
-
82
-
83
-
84
-
85
-
86
-
87
-
88
-
89
-
90
-
91
-
92
-
93
-
94
-
95
-
96
-
97
-
98
-
99
-
100
-
101
-
102
-
103
-
104
-
105
-
106
-
107
-
108
-
109
-
110
-
111
-
112
-
113
-
114
-
115
-
116
-
117
-
118
-
119
-
120
-
121
-
122
-
123
-
124
-
125
-
126
-
127
-
128
-
129
-
130
-
131
-
132
-
133
-
134
-
135
-
136
-
137
-
138
-
139
-
140
 |
 |

BERKSHIRE HATHAWAY INC.
and Subsidiaries
Management’s Discussion and Analysis of
Financial Condition and Results of Operations
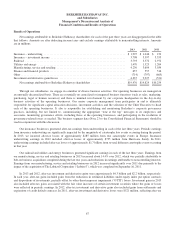
Results of Operations
Net earnings attributable to Berkshire Hathaway shareholders for each of the past three years are disaggregated in the table
that follows. Amounts are after deducting income taxes and exclude earnings attributable to noncontrolling interests. Amounts
are in millions.
2013 2012 2011
Insurance – underwriting ......................................................... $ 1,995 $ 1,046 $ 154
Insurance – investment income .................................................... 3,708 3,397 3,555
Railroad ...................................................................... 3,793 3,372 2,972
Utilities and energy ............................................................. 1,470 1,323 1,204
Manufacturing, service and retailing ................................................ 4,230 3,699 3,039
Finance and financial products ..................................................... 657 557 516
Other ......................................................................... (714) (797) (665)
Investment and derivative gains/losses .............................................. 4,337 2,227 (521)
Net earnings attributable to Berkshire Hathaway shareholders ........................ $19,476 $14,824 $10,254
Through our subsidiaries, we engage in a number of diverse business activities. Our operating businesses are managed on
an unusually decentralized basis. There are essentially no centralized or integrated business functions (such as sales, marketing,
purchasing, legal or human resources) and there is minimal involvement by our corporate headquarters in the day-to-day
business activities of the operating businesses. Our senior corporate management team participates in and is ultimately
responsible for significant capital allocation decisions, investment activities and the selection of the Chief Executive to head
each of the operating businesses. It also is responsible for establishing and monitoring Berkshire’s corporate governance
practices, including, but not limited to, communicating the appropriate “tone at the top” messages to its employees and
associates, monitoring governance efforts, including those at the operating businesses, and participating in the resolution of
governance-related issues as needed. The business segment data (Note 23 to the Consolidated Financial Statements) should be
read in conjunction with this discussion.
Our insurance businesses generated after-tax earnings from underwriting in each of the last three years. Periodic earnings
from insurance underwriting are significantly impacted by the magnitude of catastrophe loss events occurring during the period.
In 2013, we incurred after-tax losses of approximately $285 million from two catastrophe events in Europe. Insurance
underwriting earnings in 2012 included after-tax losses of approximately $725 million from Hurricane Sandy. In 2011,
underwriting earnings included after-tax losses of approximately $1.7 billion from several different catastrophe events occurring
in that year.
Our railroad and utilities and energy businesses generated significant earnings in each of the last three years. Earnings from
our manufacturing, service and retailing businesses in 2013 increased about 14.4% over 2012, which was partially attributable to
bolt-on business acquisitions completed during the last two years and reductions in earnings attributable to noncontrolling interests.
Earnings from our manufacturing, service and retailing businesses in 2012 increased significantly over 2011 due primarily to the
impact of the acquisition of The Lubrizol Corporation (“Lubrizol”), which was completed on September 16, 2011.
In 2013 and 2012, after-tax investment and derivative gains were approximately $4.3 billion and $2.2 billion, respectively.
In each year, after-tax gains included gains from the reductions in estimated liabilities under equity index put option contracts
and dispositions of investments, partially offset by other-than-temporary impairment (“OTTI”) losses. Investment gains in 2013
also included after-tax gains associated with the fair value increases of certain investment securities where the gains or losses
were reflected in periodic earnings. In 2012, after-tax investment and derivative gains also included gains from settlements and
expirations of credit default contracts. In 2011, after-tax investment and derivative losses were $521 million, reflecting after-tax
67