Berkshire Hathaway 2013 Annual Report Download - page 49
Download and view the complete annual report
Please find page 49 of the 2013 Berkshire Hathaway annual report below. You can navigate through the pages in the report by either clicking on the pages listed below, or by using the keyword search tool below to find specific information within the annual report.-
 1
1 -
2
-
3
-
4
-
5
-
6
-
7
-
8
-
9
-
10
-
11
-
12
-
13
-
14
-
15
-
16
-
17
-
18
-
19
-
20
-
21
-
22
-
23
-
24
-
25
-
26
-
27
-
28
-
29
-
30
-
31
-
32
-
33
-
34
-
35
-
36
-
37
-
38
-
 39
39 -
 40
40 -
 41
41 -
 42
42 -
 43
43 -
 44
44 -
 45
45 -
 46
46 -
 47
47 -
 48
48 -
 49
49 -
 50
50 -
 51
51 -
 52
52 -
 53
53 -
 54
54 -
 55
55 -
 56
56 -
 57
57 -
 58
58 -
 59
59 -
60
-
61
-
62
-
63
-
64
-
65
-
66
-
67
-
68
-
69
-
70
-
71
-
72
-
73
-
74
-
75
-
76
-
77
-
78
-
79
-
80
-
81
-
82
-
83
-
84
-
85
-
86
-
87
-
88
-
89
-
90
-
91
-
92
-
93
-
94
-
95
-
96
-
97
-
98
-
99
-
100
-
101
-
102
-
103
-
104
-
105
-
106
-
107
-
108
-
109
-
110
-
111
-
112
-
113
-
114
-
115
-
116
-
117
-
118
-
119
-
120
-
121
-
122
-
123
-
124
-
125
-
126
-
127
-
128
-
129
-
130
-
131
-
132
-
133
-
134
-
135
-
136
-
137
-
138
-
139
-
140
 |
 |

Notes to Consolidated Financial Statements (Continued)
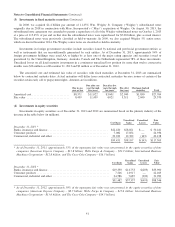
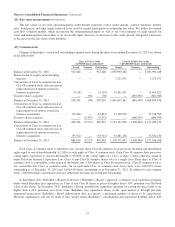
(11) Goodwill and other intangible assets (Continued)
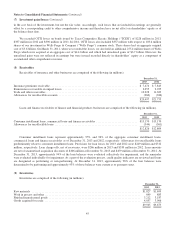
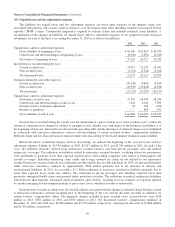
Intangible assets other than goodwill are included in other assets and are summarized as follows (in millions).
December 31, 2013 December 31, 2012
Gross carrying
amount
Accumulated
amortization
Gross carrying
amount
Accumulated
amortization
Insurance and other ........................................ $11,923 $3,723 $11,737 $2,994
Railroad, utilities and energy ................................. 2,214 1,231 2,163 913
$14,137 $4,954 $13,900 $3,907
Trademarks and trade names ................................. $ 2,750 $ 340 $ 2,819 $ 278
Patents and technology ..................................... 5,173 2,626 5,014 2,059
Customer relationships ..................................... 4,690 1,518 4,565 1,155
Other ................................................... 1,524 470 1,502 415
$14,137 $4,954 $13,900 $3,907
Amortization expense was $1,090 million in 2013, $1,008 million in 2012 and $809 million in 2011. Estimated
amortization expense over the next five years is as follows (in millions): 2014 – $1,052; 2015 – $752; 2016 – $692; 2017 – $648
and 2018 – $635. Intangible assets with indefinite lives as of December 31, 2013 and 2012 were $2,221 million and
$2,328 million, respectively.
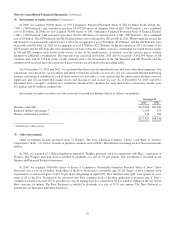
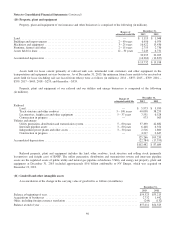
(12) Derivative contracts
Derivative contracts have been entered into primarily by our finance and financial products and our energy businesses.
Substantially all of the derivative contracts of our finance and financial products businesses are not designated as hedges for
financial reporting purposes. Changes in the fair values of such contracts are reported in earnings as derivative gains/losses. We
entered into these contracts with the expectation that the premiums received would exceed the amounts ultimately paid to
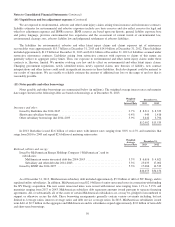
counterparties. A summary of derivative contracts of our finance and financial products businesses follows (in millions).
December 31, 2013 December 31, 2012
Assets(3) Liabilities
Notional
Value Assets(3) Liabilities
Notional
Value
Equity index put options ................................. $— $4,667 $32,095(1) $— $7,502 $33,357(1)
Credit default .......................................... — 648 7,792(2) 41 429 11,691(2)
Other, principally interest rate and foreign currency ............ — 16 130 2
$— $5,331 $171 $7,933
(1) Represents the aggregate undiscounted amount payable at the contract expiration dates assuming that the value of each
index is zero at each contract’s expiration date.
(2) Represents the maximum undiscounted future value of losses payable under the contracts, if all underlying issuers default
and the residual value of the specified obligations is zero.
(3) Included in other assets of finance and financial products businesses.
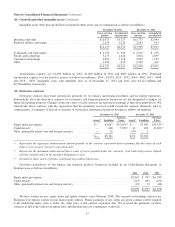
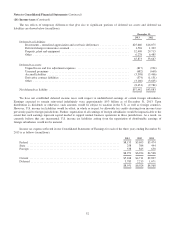
Derivative gains/losses of our finance and financial products businesses included in our Consolidated Statements of
Earnings were as follows (in millions).
2013 2012 2011
Equity index put options ............................................................ $2,843 $ 997 $(1,787)
Credit default .................................................................... (213) 894 (251)
Other, principally interest rate and foreign currency ...................................... (22) 72 (66)
$2,608 $1,963 $(2,104)
We have written no new equity index put option contracts since February 2008. The currently outstanding contracts are
European style options written on four major equity indexes. Future payments, if any, under any given contract will be required
if the underlying index value is below the strike price at the contract expiration date. We received the premiums on these
contracts in full at the contract inception dates and therefore have no counterparty credit risk.
47