Berkshire Hathaway 2013 Annual Report Download - page 50
Download and view the complete annual report
Please find page 50 of the 2013 Berkshire Hathaway annual report below. You can navigate through the pages in the report by either clicking on the pages listed below, or by using the keyword search tool below to find specific information within the annual report.-
 1
1 -
2
-
3
-
4
-
5
-
6
-
7
-
8
-
9
-
10
-
11
-
12
-
13
-
14
-
15
-
16
-
17
-
18
-
19
-
20
-
21
-
22
-
23
-
24
-
25
-
26
-
27
-
28
-
29
-
30
-
31
-
32
-
33
-
34
-
35
-
36
-
37
-
38
-
39
-
 40
40 -
 41
41 -
 42
42 -
 43
43 -
 44
44 -
 45
45 -
 46
46 -
 47
47 -
 48
48 -
 49
49 -
 50
50 -
 51
51 -
 52
52 -
 53
53 -
 54
54 -
 55
55 -
 56
56 -
 57
57 -
 58
58 -
 59
59 -
 60
60 -
61
-
62
-
63
-
64
-
65
-
66
-
67
-
68
-
69
-
70
-
71
-
72
-
73
-
74
-
75
-
76
-
77
-
78
-
79
-
80
-
81
-
82
-
83
-
84
-
85
-
86
-
87
-
88
-
89
-
90
-
91
-
92
-
93
-
94
-
95
-
96
-
97
-
98
-
99
-
100
-
101
-
102
-
103
-
104
-
105
-
106
-
107
-
108
-
109
-
110
-
111
-
112
-
113
-
114
-
115
-
116
-
117
-
118
-
119
-
120
-
121
-
122
-
123
-
124
-
125
-
126
-
127
-
128
-
129
-
130
-
131
-
132
-
133
-
134
-
135
-
136
-
137
-
138
-
139
-
140
 |
 |

Notes to Consolidated Financial Statements (Continued)
(12) Derivative contracts (Continued)
The aggregate intrinsic value (which is the undiscounted liability assuming the contracts are settled based on the index
values and foreign currency exchange rates as of the balance sheet date) of our equity index put option contracts was
approximately $1.7 billion at December 31, 2013 and $3.9 billion at December 31, 2012. However, these contracts may not be
unilaterally terminated or fully settled before the expiration dates which occur between June 2018 and January 2026. Therefore,
the ultimate amount of cash basis gains or losses on these contracts will not be determined for many years. The remaining
weighted average life of all contracts was approximately 7.0 years at December 31, 2013.
Prior to March 2009, credit default contracts were written on various indexes of non-investment grade (or “high yield”)
corporate issuers, as well as investment grade corporate and state/municipal debt issuers. These contracts cover the loss in value
of specified debt obligations of the issuers arising from default events, which are usually from their failure to make payments or
bankruptcy. Loss amounts are subject to contract limits. During 2013, all of our remaining high yield and investment grade
corporate issuer contracts expired.
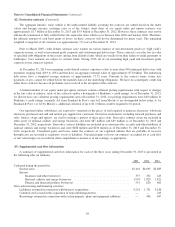
At December 31, 2013 our remaining credit default contract exposures relate to more than 500 municipal debt issues with
maturities ranging from 2019 to 2054 and that have an aggregate notional value of approximately $7.8 billion. The underlying
debt issues have a weighted average maturity of approximately 17.75 years. Pursuant to the contract terms, future loss
payments, if any, cannot be settled before the maturity dates of the underlying obligations. We have no counterparty credit risk
under these contracts because all premiums were received at the inception of the contracts.
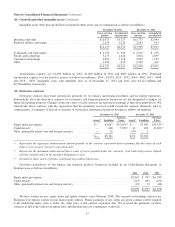
A limited number of our equity index put option contracts contain collateral posting requirements with respect to changes
in the fair value or intrinsic value of the contracts and/or a downgrade of Berkshire’s credit ratings. As of December 31, 2013,
we did not have any collateral posting requirements and at December 31, 2012, our posting requirements were $40 million. If
Berkshire’s credit ratings (currently AA from Standard & Poor’s and Aa2 from Moody’s) are downgraded below either A- by
Standard & Poor’s or A3 by Moody’s, additional collateral of up to $1.1 billion could be required to be posted.
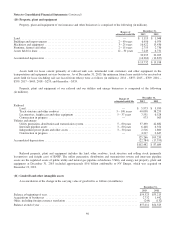
Our regulated utility subsidiaries are exposed to variations in the prices of fuel required to generate electricity, wholesale
electricity purchased and sold and natural gas supplied for customers. Derivative instruments, including forward purchases and
sales, futures, swaps and options, are used to manage a portion of these price risks. Derivative contract assets are included in
other assets of railroad, utilities and energy businesses and were $87 million and $49 million as of December 31, 2013 and
December 31, 2012, respectively. Derivative contract liabilities are included in accounts payable, accruals and other liabilities of
railroad, utilities and energy businesses and were $208 million and $234 million as of December 31, 2013 and December 31,
2012, respectively. Unrealized gains and losses under the contracts of our regulated utilities that are probable of recovery
through rates are recorded as regulatory assets or liabilities. Unrealized gains or losses on contracts accounted for as cash flow
or fair value hedges are recorded in other comprehensive income or in net earnings, as appropriate.
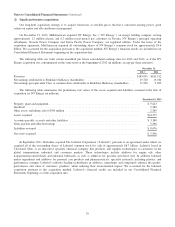
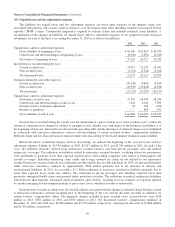
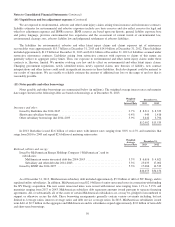
(13) Supplemental cash flow information
A summary of supplemental cash flow information for each of the three years ending December 31, 2013 is presented in
the following table (in millions).
2013 2012 2011
Cash paid during the period for:
Income taxes .................................................................. $5,401 $4,695 $2,885
Interest:
Insurance and other businesses ............................................... 375 352 243
Railroad, utilities and energy businesses ........................................ 1,958 1,829 1,821
Finance and financial products businesses ....................................... 541 620 662
Non-cash investing and financing activities:
Liabilities assumed in connection with business acquisitions ............................ 9,224 1,751 5,836
Common stock issued in the acquisition of noncontrolling interests ....................... — — 245
Borrowings assumed in connection with certain property, plant and equipment additions ..... — 406 647
48