Berkshire Hathaway 2013 Annual Report Download - page 83
Download and view the complete annual report
Please find page 83 of the 2013 Berkshire Hathaway annual report below. You can navigate through the pages in the report by either clicking on the pages listed below, or by using the keyword search tool below to find specific information within the annual report.-
 1
1 -
2
-
3
-
4
-
5
-
6
-
7
-
8
-
9
-
10
-
11
-
12
-
13
-
14
-
15
-
16
-
17
-
18
-
19
-
20
-
21
-
22
-
23
-
24
-
25
-
26
-
27
-
28
-
29
-
30
-
31
-
32
-
33
-
34
-
35
-
36
-
37
-
38
-
39
-
40
-
41
-
42
-
43
-
44
-
45
-
46
-
47
-
48
-
49
-
50
-
51
-
52
-
53
-
54
-
55
-
56
-
57
-
58
-
59
-
60
-
61
-
62
-
63
-
64
-
65
-
66
-
67
-
68
-
69
-
70
-
71
-
72
-
 73
73 -
 74
74 -
 75
75 -
 76
76 -
 77
77 -
 78
78 -
 79
79 -
 80
80 -
 81
81 -
 82
82 -
 83
83 -
 84
84 -
 85
85 -
 86
86 -
 87
87 -
 88
88 -
 89
89 -
 90
90 -
 91
91 -
 92
92 -
 93
93 -
94
-
95
-
96
-
97
-
98
-
99
-
100
-
101
-
102
-
103
-
104
-
105
-
106
-
107
-
108
-
109
-
110
-
111
-
112
-
113
-
114
-
115
-
116
-
117
-
118
-
119
-
120
-
121
-
122
-
123
-
124
-
125
-
126
-
127
-
128
-
129
-
130
-
131
-
132
-
133
-
134
-
135
-
136
-
137
-
138
-
139
-
140
 |
 |
Management’s Discussion (Continued)
Manufacturing, Service and Retailing (Continued)
Marmon (Continued)
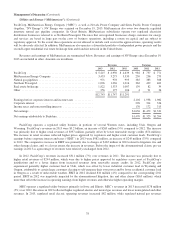
Marmon’s consolidated revenues in 2013 were approximately $7.0 billion, 2.7% below 2012, with almost 60% of the
decline associated with metals price deflation. Consolidated pre-tax earnings were $1.2 billion, an increase of 3.4% over 2012.
Pre-tax earnings in 2013 as a percentage of revenues was 16.9% in 2013 compared with 15.9% in 2012. This margin
improvement is a direct result of Marmon’s focus on niche products/markets, product/service innovation and improvement in
operating efficiency and productivity. The pre-tax earnings information in the paragraphs that follow, exclude unallocated
corporate expenses of $30 million in 2013 and $34 million in 2012.
Engineered Components’ 2013 revenues were $2.3 billion, a decline of 5% as compared to 2012. The revenue decline was
primarily due to the impact of lower metals (steel and copper) costs, which are passed on to customers with minimal margin, as
well as reductions in volume in Distribution Services, partially offset by increased volume in the Industrial Products sector.
Engineered Components’ pre-tax earnings were $204 million in 2013, representing a decline of 4% from earnings in 2012. The
decline in pre-tax earnings in 2013 reflected reduced margins in the Distribution Services sector, attributable to lower sales
volumes and steel price reductions. Electrical & Plumbing Products sector 2013 pre-tax earnings increased over 2012, despite
lower revenues. Restructuring actions taken in 2012 and 2013 have provided the impetus for improved pre-tax earnings in this
sector. Industrial Products sector pre-tax earnings increase in 2013 over 2012 was driven by higher volumes and improved
product mix.
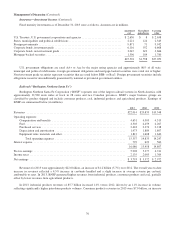
Natural Resources’ revenues were $2.5 billion in 2013, a decline of 3% compared to 2012. The decrease in revenues was
attributable to several non-recurring large prior year projects in the Transportation Services & Engineered Products (“TSEP”)
and Engineered Wire and Cable sectors and lower revenues from external tank car sales, partially offset by higher rail leasing
revenues attributable to higher lease rates and new tank car fleet additions. Natural Resources’ pre-tax earnings were $718
million in 2013, an increase of 3% over 2012. Earnings in 2013 reflected higher rail leasing rates and new tank car fleet
additions which more than offset the prior year higher project revenues, higher railcar repair costs and lower sales volume of
external tank cars.
Retail Technologies’ revenues were $2.2 billion in 2013, unchanged from 2012. Revenues increased in 2013 in Highway
Technologies’ driven by growth in the automotive clutch and heavy duty truck axle businesses, Retail Store Fixtures, as a result
of a significant store fixture display product rollout for a key customer and Water Treatment, driven by growth in residential
products. These revenue increases were offset by a revenue decrease at Retail Home Improvement Products due to a planned
reduction in revenues from lower margin products. Retail Technologies’ pre-tax earnings in 2013 were $284 million which
represented an increase of 8% over 2012. The pre-tax earnings increases were primarily due to revenue growth in the Highway
Technologies, Retail Store Fixtures and Water Treatment sectors, as well as cost savings related to 2012 restructuring actions
taken in the Retail Store Fixtures sector.
Marmon’s consolidated revenues in 2012 were $7.2 billion, an increase of 3.6% over 2011. Consolidated pre-tax earnings
were $1.1 billion in 2012, an increase of 14.6% over 2011. In 2012 pre-tax earnings as a percentage of revenues were 15.9%
compared to 14.3% in 2011.
Engineered Components’ 2012 revenues were $2.4 billion, a decline of 2% as compared to 2011. The revenue decline was
primarily due to lower volume and copper pricing in the Electrical & Plumbing Products sector driven by lower HVAC demand
and continued softness in commercial construction in 2012, offset in part by a 2012 bolt-on acquisition and increased market
share in certain market niches in the Distribution Services sector. Engineered Components’ pre-tax earnings were $214 million,
an increase of 3% from 2011. The increase in pre-tax earnings in 2012 reflected the growth in market share and higher margins
in the Distribution Services sector, partially offset by the revenue declines in the Electrical & Plumbing Products sector.
Natural Resources’ revenues were $2.6 billion in 2012, an increase of 10% compared to 2011. The increase in revenues
was attributable to bolt-on acquisitions in the Crane Services and Engineered Wire & Cable sectors in 2012 and growth in the
81