Berkshire Hathaway 2013 Annual Report Download - page 78
Download and view the complete annual report
Please find page 78 of the 2013 Berkshire Hathaway annual report below. You can navigate through the pages in the report by either clicking on the pages listed below, or by using the keyword search tool below to find specific information within the annual report.-
 1
1 -
2
-
3
-
4
-
5
-
6
-
7
-
8
-
9
-
10
-
11
-
12
-
13
-
14
-
15
-
16
-
17
-
18
-
19
-
20
-
21
-
22
-
23
-
24
-
25
-
26
-
27
-
28
-
29
-
30
-
31
-
32
-
33
-
34
-
35
-
36
-
37
-
38
-
39
-
40
-
41
-
42
-
43
-
44
-
45
-
46
-
47
-
48
-
49
-
50
-
51
-
52
-
53
-
54
-
55
-
56
-
57
-
58
-
59
-
60
-
61
-
62
-
63
-
64
-
65
-
66
-
67
-
 68
68 -
 69
69 -
 70
70 -
 71
71 -
 72
72 -
 73
73 -
 74
74 -
 75
75 -
 76
76 -
 77
77 -
 78
78 -
 79
79 -
 80
80 -
 81
81 -
 82
82 -
 83
83 -
 84
84 -
 85
85 -
 86
86 -
 87
87 -
 88
88 -
89
-
90
-
91
-
92
-
93
-
94
-
95
-
96
-
97
-
98
-
99
-
100
-
101
-
102
-
103
-
104
-
105
-
106
-
107
-
108
-
109
-
110
-
111
-
112
-
113
-
114
-
115
-
116
-
117
-
118
-
119
-
120
-
121
-
122
-
123
-
124
-
125
-
126
-
127
-
128
-
129
-
130
-
131
-
132
-
133
-
134
-
135
-
136
-
137
-
138
-
139
-
140
 |
 |

Management’s Discussion (Continued)
Insurance—Investment Income (Continued)
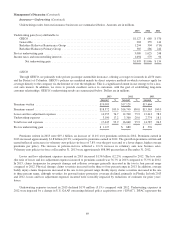
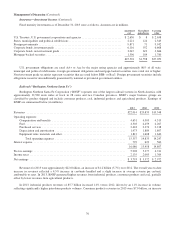
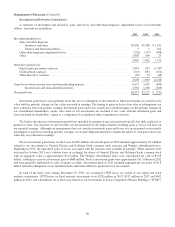
Fixed maturity investments as of December 31, 2013 were as follows. Amounts are in millions.
Amortized
cost
Unrealized
gains/losses
Carrying
value
U.S. Treasury, U.S. government corporations and agencies ............................ $ 2,650 $ 8 $ 2,658
States, municipalities and political subdivisions ..................................... 2,221 124 2,345
Foreign governments .......................................................... 9,871 71 9,942
Corporate bonds, investment grade ............................................... 6,116 552 6,668
Corporate bonds, non-investment grade ........................................... 3,047 619 3,666
Mortgage-backed securities ..................................................... 1,596 184 1,780
$25,501 $1,558 $27,059
U.S. government obligations are rated AA+ or Aaa by the major rating agencies and approximately 86% of all state,
municipal and political subdivisions, foreign government obligations and mortgage-backed securities were rated AA or higher.
Non-investment grade securities represent securities that are rated below BBB- or Baa3. Foreign government securities include
obligations issued or unconditionally guaranteed by national or provincial government entities.
Railroad (“Burlington Northern Santa Fe”)
Burlington Northern Santa Fe Corporation (“BNSF”) operates one of the largest railroad systems in North America with
approximately 32,500 route miles of track in 28 states and two Canadian provinces. BNSF’s major business groups are
classified by product shipped and include consumer products, coal, industrial products and agricultural products. Earnings of
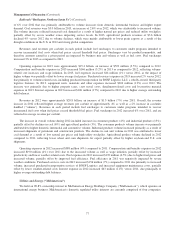
BNSF are summarized below (in millions).
2013 2012 2011
Revenues ..................................................................... $22,014 $20,835 $19,548
Operating expenses:
Compensation and benefits ................................................... 4,651 4,505 4,315
Fuel ...................................................................... 4,503 4,459 4,267
Purchased services .......................................................... 2,418 2,374 2,218
Depreciation and amortization ................................................. 1,973 1,889 1,807
Equipment rents, materials and other ............................................ 1,812 1,608 1,640
Total operating expenses ................................................. 15,357 14,835 14,247
Interest expense ................................................................ 729 623 560
16,086 15,458 14,807
Pre-tax earnings ................................................................ 5,928 5,377 4,741
Income taxes ................................................................... 2,135 2,005 1,769
Net earnings ................................................................... $ 3,793 $ 3,372 $ 2,972
Revenues for 2013 were approximately $22.0 billion, an increase of $1.2 billion (5.7%) over 2012. The overall year-to-date
increase in revenues reflected a 4.5% increase in cars/units handled and a slight increase in average revenue per car/unit,
attributable to rates. In 2013, BNSF generated higher revenues from industrial products, consumer products and coal, partially
offset by lower revenues from agricultural products.
In 2013, industrial products revenues of $5.7 billion increased 14% versus 2012, driven by an 11% increase in volume,
reflecting significantly higher petroleum products volumes. Consumer products revenues in 2013 were $7.0 billion, an increase
76