Berkshire Hathaway 2013 Annual Report Download - page 31
Download and view the complete annual report
Please find page 31 of the 2013 Berkshire Hathaway annual report below. You can navigate through the pages in the report by either clicking on the pages listed below, or by using the keyword search tool below to find specific information within the annual report.-
 1
1 -
2
-
3
-
4
-
5
-
6
-
7
-
8
-
9
-
10
-
11
-
12
-
13
-
14
-
15
-
16
-
17
-
18
-
19
-
20
-
 21
21 -
 22
22 -
 23
23 -
 24
24 -
 25
25 -
 26
26 -
 27
27 -
 28
28 -
 29
29 -
 30
30 -
 31
31 -
 32
32 -
 33
33 -
 34
34 -
 35
35 -
 36
36 -
 37
37 -
 38
38 -
 39
39 -
 40
40 -
 41
41 -
42
-
43
-
44
-
45
-
46
-
47
-
48
-
49
-
50
-
51
-
52
-
53
-
54
-
55
-
56
-
57
-
58
-
59
-
60
-
61
-
62
-
63
-
64
-
65
-
66
-
67
-
68
-
69
-
70
-
71
-
72
-
73
-
74
-
75
-
76
-
77
-
78
-
79
-
80
-
81
-
82
-
83
-
84
-
85
-
86
-
87
-
88
-
89
-
90
-
91
-
92
-
93
-
94
-
95
-
96
-
97
-
98
-
99
-
100
-
101
-
102
-
103
-
104
-
105
-
106
-
107
-
108
-
109
-
110
-
111
-
112
-
113
-
114
-
115
-
116
-
117
-
118
-
119
-
120
-
121
-
122
-
123
-
124
-
125
-
126
-
127
-
128
-
129
-
130
-
131
-
132
-
133
-
134
-
135
-
136
-
137
-
138
-
139
-
140
 |
 |

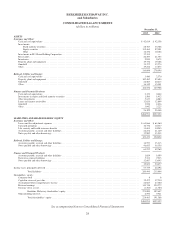
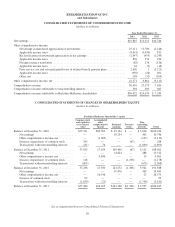
BERKSHIRE HATHAWAY INC.
and Subsidiaries
CONSOLIDATED STATEMENTS OF EARNINGS
(dollars in millions except per-share amounts)
Year Ended December 31,
2013 2012 2011
Revenues:
Insurance and Other:
Insurance premiums earned ...................................................... $ 36,684 $ 34,545 $ 32,075
Sales and service revenues ....................................................... 94,806 83,268 72,803
Interest, dividend and other investment income ....................................... 4,939 4,534 4,792
Investment gains/losses .......................................................... 3,881 990 1,065
140,310 123,337 110,735
Railroad, Utilities and Energy:
Operating revenues ............................................................. 34,649 32,383 30,721
Other ........................................................................ 108 199 118
34,757 32,582 30,839
Finance and Financial Products:
Interest, dividend and other investment income ....................................... 1,469 1,572 1,618
Investment gains/losses .......................................................... 184 472 209
Derivative gains/losses .......................................................... 2,608 1,963 (2,104)
Other ........................................................................ 2,822 2,537 2,391
7,083 6,544 2,114
182,150 162,463 143,688
Costs and expenses:
Insurance and Other:
Insurance losses and loss adjustment expenses ....................................... 21,275 20,113 20,829
Life, annuity and health insurance benefits .......................................... 5,072 5,114 4,879
Insurance underwriting expenses .................................................. 7,248 7,693 6,119
Cost of sales and services ........................................................ 77,053 67,536 59,839
Selling, general and administrative expenses ......................................... 11,917 10,503 8,670
Interest expense ................................................................ 426 397 308
122,991 111,356 100,644
Railroad, Utilities and Energy:
Cost of sales and operating expenses ............................................... 25,157 23,816 22,736
Interest expense ................................................................ 1,865 1,745 1,703
27,022 25,561 24,439
Finance and Financial Products:
Interest expense ................................................................ 510 602 653
Other ........................................................................ 2,831 2,708 2,638
3,341 3,310 3,291
153,354 140,227 128,374
Earnings before income taxes ....................................................... 28,796 22,236 15,314
Income tax expense ............................................................. 8,951 6,924 4,568
Net earnings ...................................................................... 19,845 15,312 10,746
Less: Earnings attributable to noncontrolling interests .................................. 369 488 492
Net earnings attributable to Berkshire Hathaway shareholders ........................... $ 19,476 $ 14,824 $ 10,254
Average common shares outstanding * ............................................. 1,643,613 1,651,294 1,649,891
Net earnings per share attributable to Berkshire Hathaway shareholders * ................. $ 11,850 $ 8,977 $ 6,215
* Average shares outstanding include average Class A common shares and average Class B common shares determined on an equivalent
Class A common stock basis. Net earnings per common share attributable to Berkshire Hathaway shown above represents net earnings per
equivalent Class A common share. Net earnings per Class B common share is equal to one-fifteen-hundredth (1/1,500) of such amount or
$7.90 per share for 2013, $5.98 per share for 2012 and $4.14 per share for 2011.
See accompanying Notes to Consolidated Financial Statements
29