Berkshire Hathaway 2013 Annual Report Download - page 82
Download and view the complete annual report
Please find page 82 of the 2013 Berkshire Hathaway annual report below. You can navigate through the pages in the report by either clicking on the pages listed below, or by using the keyword search tool below to find specific information within the annual report.-
 1
1 -
2
-
3
-
4
-
5
-
6
-
7
-
8
-
9
-
10
-
11
-
12
-
13
-
14
-
15
-
16
-
17
-
18
-
19
-
20
-
21
-
22
-
23
-
24
-
25
-
26
-
27
-
28
-
29
-
30
-
31
-
32
-
33
-
34
-
35
-
36
-
37
-
38
-
39
-
40
-
41
-
42
-
43
-
44
-
45
-
46
-
47
-
48
-
49
-
50
-
51
-
52
-
53
-
54
-
55
-
56
-
57
-
58
-
59
-
60
-
61
-
62
-
63
-
64
-
65
-
66
-
67
-
68
-
69
-
70
-
71
-
 72
72 -
 73
73 -
 74
74 -
 75
75 -
 76
76 -
 77
77 -
 78
78 -
 79
79 -
 80
80 -
 81
81 -
 82
82 -
 83
83 -
 84
84 -
 85
85 -
 86
86 -
 87
87 -
 88
88 -
 89
89 -
 90
90 -
 91
91 -
 92
92 -
93
-
94
-
95
-
96
-
97
-
98
-
99
-
100
-
101
-
102
-
103
-
104
-
105
-
106
-
107
-
108
-
109
-
110
-
111
-
112
-
113
-
114
-
115
-
116
-
117
-
118
-
119
-
120
-
121
-
122
-
123
-
124
-
125
-
126
-
127
-
128
-
129
-
130
-
131
-
132
-
133
-
134
-
135
-
136
-
137
-
138
-
139
-
140
 |
 |

Management’s Discussion (Continued)
Utilities and Energy (“MidAmerican”) (Continued)
offset by the impact of one-time customer refunds issued by NV Energy and impairment losses associated with MidAmerican’s
interests in certain geothermal electricity generation projects. EBIT in 2013 from other activities declined $87 million compared
to 2012, as the impacts of the aforementioned losses associated with geothermal projects and NV Energy acquisition costs and
customer refunds, more than offset the increase in earnings from the new solar and wind-powered electricity generation
projects.
Corporate interest includes interest on the unsecured debt issued by MidAmerican Energy Holding Company. Corporate
interest expense in 2014 is expected to increase compared to recent years as a result of new borrowings in connection with the
NV Energy acquisition, including borrowings from certain Berkshire insurance subsidiaries.
MidAmerican’s consolidated income tax expense as percentages of pre-tax earnings were 7% in 2013, 9% in 2012 and
18% in 2011. In each year, MidAmerican’s utility subsidiaries generated significant production tax credits. In addition, pre-tax
earnings of Northern Powergrid are taxed at lower rates in the U.K. and each year also benefitted from reductions of deferred
income taxes as a result of lower enacted corporate income tax rates in the U.K.
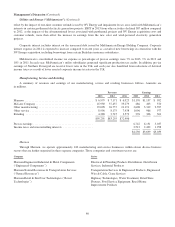
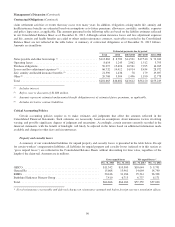
Manufacturing, Service and Retailing
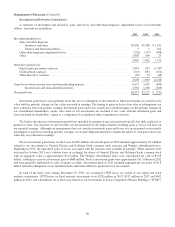
A summary of revenues and earnings of our manufacturing, service and retailing businesses follows. Amounts are
in millions.
Revenues Earnings
2013 2012 2011 2013 2012 2011
Marmon ................................................ $ 6,979 $ 7,171 $ 6,925 $1,176 $1,137 $ 992
McLane Company ........................................ 45,930 37,437 33,279 486 403 370
Other manufacturing ...................................... 29,098 26,757 21,191 3,608 3,319 2,397
Other service ............................................ 8,996 8,175 7,438 1,096 966 977
Retailing ............................................... 4,288 3,715 3,573 376 306 301
$95,291 $83,255 $72,406
Pre-tax earnings .......................................... 6,742 6,131 5,037
Income taxes and noncontrolling interests ..................... 2,512 2,432 1,998
$4,230 $3,699 $3,039
Marmon
Through Marmon, we operate approximately 160 manufacturing and service businesses within eleven diverse business
sectors that are further organized in three separate companies. Those companies and constituent sectors are:
Company Sector
Marmon Engineered Industrial & Metal Components
(“Engineered Components”)
Electrical & Plumbing Products Distribution, Distribution
Services, Industrial Products
Marmon Natural Resources & Transportation Services
(“Natural Resources”)
Transportation Services & Engineered Products, Engineered
Wire & Cable, Crane Services
Marmon Retail & End User Technologies (“Retail
Technologies”)
Highway Technologies, Water Treatment, Retail Store
Fixtures, Food Service Equipment, Retail Home
Improvement Products
80