Berkshire Hathaway 2013 Annual Report Download - page 77
Download and view the complete annual report
Please find page 77 of the 2013 Berkshire Hathaway annual report below. You can navigate through the pages in the report by either clicking on the pages listed below, or by using the keyword search tool below to find specific information within the annual report.-
 1
1 -
2
-
3
-
4
-
5
-
6
-
7
-
8
-
9
-
10
-
11
-
12
-
13
-
14
-
15
-
16
-
17
-
18
-
19
-
20
-
21
-
22
-
23
-
24
-
25
-
26
-
27
-
28
-
29
-
30
-
31
-
32
-
33
-
34
-
35
-
36
-
37
-
38
-
39
-
40
-
41
-
42
-
43
-
44
-
45
-
46
-
47
-
48
-
49
-
50
-
51
-
52
-
53
-
54
-
55
-
56
-
57
-
58
-
59
-
60
-
61
-
62
-
63
-
64
-
65
-
66
-
 67
67 -
 68
68 -
 69
69 -
 70
70 -
 71
71 -
 72
72 -
 73
73 -
 74
74 -
 75
75 -
 76
76 -
 77
77 -
 78
78 -
 79
79 -
 80
80 -
 81
81 -
 82
82 -
 83
83 -
 84
84 -
 85
85 -
 86
86 -
 87
87 -
88
-
89
-
90
-
91
-
92
-
93
-
94
-
95
-
96
-
97
-
98
-
99
-
100
-
101
-
102
-
103
-
104
-
105
-
106
-
107
-
108
-
109
-
110
-
111
-
112
-
113
-
114
-
115
-
116
-
117
-
118
-
119
-
120
-
121
-
122
-
123
-
124
-
125
-
126
-
127
-
128
-
129
-
130
-
131
-
132
-
133
-
134
-
135
-
136
-
137
-
138
-
139
-
140
 |
 |

Management’s Discussion (Continued)
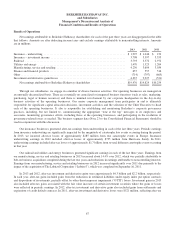
Insurance—Investment Income
A summary of net investment income of our insurance operations follows. Amounts are in millions.
2013 2012 2011
Investment income before taxes and noncontrolling interests ................................ $4,713 $4,454 $4,725
Income taxes and noncontrolling interests ............................................... 1,005 1,057 1,170
Net investment income .............................................................. $3,708 $3,397 $3,555
Investment income consists of interest and dividends earned on cash and investments of our insurance businesses. Pre-tax
investment income in 2013 increased $259 million (5.8%) compared to 2012. The increase was primarily attributable to
increased dividends earned on equity investments, which reflected increased dividend rates for certain of our larger equity
holdings as well as increased overall investments in equity securities.
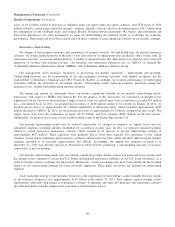
Beginning with the fourth quarter of 2013, investment income no longer includes interest from our investments in Wrigley
11.45% subordinated notes ($4.4 billion par), as a result of the repurchase of those notes by Mars/Wrigley. In addition, other
higher yielding fixed maturity investments were redeemed in 2013 or will mature in 2014. Investment income in 2014 is
expected to decline compared to 2013 given that investment opportunities currently available will likely generate considerably
lower yields. We continue to hold significant cash and cash equivalents earning very low yields. However, we believe that
maintaining ample liquidity is paramount and we insist on safety over yield with respect to cash and cash equivalents.
Pre-tax investment income in 2012 declined $271 million (6%) compared to 2011. The decline reflected the redemptions in
2011 of our investments in Goldman Sachs 10% Preferred Stock (insurance subsidiaries held 87% of the $5 billion aggregate
investment) and in General Electric 10% Preferred Stock ($3 billion aggregate investment). Dividends earned by our insurance
subsidiaries from these investments were $420 million in 2011. Investment income in 2012 reflected dividends earned for the
full year from our investment in September 2011 in Bank of America 6% Preferred Stock (insurance subsidiaries hold 80% of
the $5 billion aggregate investment) and increased dividend rates with respect to several of our common stock investments.
Invested assets derive from shareholder capital and reinvested earnings as well as net liabilities under insurance contracts
or “float.” The major components of float are unpaid losses, life, annuity and health benefit liabilities, unearned premiums and
other liabilities to policyholders less premium and reinsurance receivables, deferred charges assumed under retroactive
reinsurance contracts and deferred policy acquisition costs. Float approximated $77 billion at December 31, 2013, $73 billion at
December 31, 2012, and $70 billion at December 31, 2011. The cost of float was negative over the last three years as our
insurance business generated underwriting gains in each year.
A summary of cash and investments held in our insurance businesses as of December 31, 2013 and 2012 follows. Other
investments include investments in The Dow Chemical Company and Bank of America Corporation. See Note 5 to the
Consolidated Financial Statements. Amounts are in millions.
December 31,
2013 2012
Cash and cash equivalents ............................................................... $ 32,572 $ 26,458
Equity securities ...................................................................... 114,832 86,694
Fixed maturity securities ................................................................ 27,059 35,243
Other investments ..................................................................... 12,334 10,184
$186,797 $158,579
75