Berkshire Hathaway 2013 Annual Report Download - page 57
Download and view the complete annual report
Please find page 57 of the 2013 Berkshire Hathaway annual report below. You can navigate through the pages in the report by either clicking on the pages listed below, or by using the keyword search tool below to find specific information within the annual report.-
 1
1 -
2
-
3
-
4
-
5
-
6
-
7
-
8
-
9
-
10
-
11
-
12
-
13
-
14
-
15
-
16
-
17
-
18
-
19
-
20
-
21
-
22
-
23
-
24
-
25
-
26
-
27
-
28
-
29
-
30
-
31
-
32
-
33
-
34
-
35
-
36
-
37
-
38
-
39
-
40
-
41
-
42
-
43
-
44
-
45
-
46
-
 47
47 -
 48
48 -
 49
49 -
 50
50 -
 51
51 -
 52
52 -
 53
53 -
 54
54 -
 55
55 -
 56
56 -
 57
57 -
 58
58 -
 59
59 -
 60
60 -
 61
61 -
 62
62 -
 63
63 -
 64
64 -
 65
65 -
 66
66 -
 67
67 -
68
-
69
-
70
-
71
-
72
-
73
-
74
-
75
-
76
-
77
-
78
-
79
-
80
-
81
-
82
-
83
-
84
-
85
-
86
-
87
-
88
-
89
-
90
-
91
-
92
-
93
-
94
-
95
-
96
-
97
-
98
-
99
-
100
-
101
-
102
-
103
-
104
-
105
-
106
-
107
-
108
-
109
-
110
-
111
-
112
-
113
-
114
-
115
-
116
-
117
-
118
-
119
-
120
-
121
-
122
-
123
-
124
-
125
-
126
-
127
-
128
-
129
-
130
-
131
-
132
-
133
-
134
-
135
-
136
-
137
-
138
-
139
-
140
 |
 |

Notes to Consolidated Financial Statements (Continued)
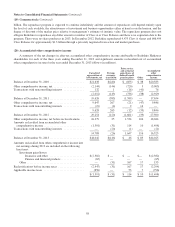
(18) Fair value measurements (Continued)
The fair values of substantially all of our financial instruments were measured using market or income approaches.
Considerable judgment may be required in interpreting market data used to develop the estimates of fair value. Accordingly, the
fair values presented are not necessarily indicative of the amounts that could be realized in an actual current market exchange.
The use of alternative market assumptions and/or estimation methodologies may have a material effect on the estimated fair
value. The hierarchy for measuring fair value consists of Levels 1 through 3, which are described below.
Level 1 – Inputs represent unadjusted quoted prices for identical assets or liabilities exchanged in active markets.
Level 2 – Inputs include directly or indirectly observable inputs (other than Level 1 inputs) such as quoted prices for
similar assets or liabilities exchanged in active or inactive markets; quoted prices for identical assets or liabilities
exchanged in inactive markets; other inputs that may be considered in fair value determinations of the assets or liabilities,
such as interest rates and yield curves, volatilities, prepayment speeds, loss severities, credit risks and default rates; and
inputs that are derived principally from or corroborated by observable market data by correlation or other means. Pricing
evaluations generally reflect discounted expected future cash flows, which incorporate yield curves for instruments with
similar characteristics, such as credit ratings, estimated durations and yields for other instruments of the issuer or entities in
the same industry sector.
Level 3 – Inputs include unobservable inputs used in the measurement of assets and liabilities. Management is required to
use its own assumptions regarding unobservable inputs because there is little, if any, market activity in the assets or
liabilities and we may be unable to corroborate the related observable inputs. Unobservable inputs require management to
make certain projections and assumptions about the information that would be used by market participants in pricing assets
or liabilities.
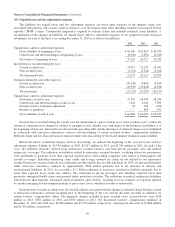
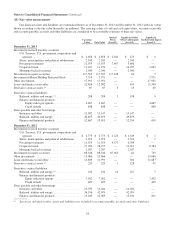
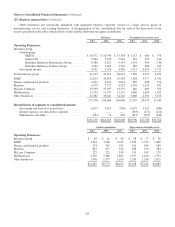
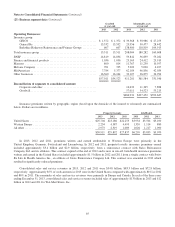
Reconciliations of assets and liabilities measured and carried at fair value on a recurring basis with the use of significant
unobservable inputs (Level 3) for each of three years ending December 31, 2013 follow (in millions).
Investments
in fixed
maturity
securities
Investments
in equity
securities
and other
investments
Net
derivative
contract
liabilities
Balance at December 31, 2010 ................................................. $801 $17,624 $(8,222)
Gains (losses) included in:
Earnings .............................................................. — — (2,035)
Other comprehensive income .............................................. 5 (2,133) (3)
Regulatory assets and liabilities ............................................ — — 144
Acquisitions ............................................................... 17 5,000 (68)
Dispositions and settlements .................................................. (39) — 275
Transfers into (out of) Level 3 ................................................. — (8,800) 1
Balance at December 31, 2011 ................................................. 784 11,691 (9,908)
Gains (losses) included in:
Earnings .............................................................. — — 1,873
Other comprehensive income .............................................. 5 4,094 —
Regulatory assets and liabilities ............................................ — — (2)
Acquisitions, dispositions and settlements ........................................ (8) — 190
Transfers into (out of) Level 3 ................................................. (129) — —
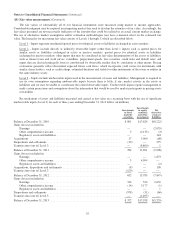
Balance at December 31, 2012 ................................................. 652 15,785 (7,847)
Gains (losses) included in:
Earnings .............................................................. 312 522 2,652
Other comprehensive income .............................................. (14) 3,177 (1)
Regulatory assets and liabilities ............................................ — — 1
Dispositions and settlements .................................................. (578) (31) (60)
Transfers into (out of) Level 3 ................................................. — (1,495) —
Balance at December 31, 2013 ................................................. $372 $17,958 $(5,255)
55