Berkshire Hathaway 2013 Annual Report Download - page 71
Download and view the complete annual report
Please find page 71 of the 2013 Berkshire Hathaway annual report below. You can navigate through the pages in the report by either clicking on the pages listed below, or by using the keyword search tool below to find specific information within the annual report.-
 1
1 -
2
-
3
-
4
-
5
-
6
-
7
-
8
-
9
-
10
-
11
-
12
-
13
-
14
-
15
-
16
-
17
-
18
-
19
-
20
-
21
-
22
-
23
-
24
-
25
-
26
-
27
-
28
-
29
-
30
-
31
-
32
-
33
-
34
-
35
-
36
-
37
-
38
-
39
-
40
-
41
-
42
-
43
-
44
-
45
-
46
-
47
-
48
-
49
-
50
-
51
-
52
-
53
-
54
-
55
-
56
-
57
-
58
-
59
-
60
-
 61
61 -
 62
62 -
 63
63 -
 64
64 -
 65
65 -
 66
66 -
 67
67 -
 68
68 -
 69
69 -
 70
70 -
 71
71 -
 72
72 -
 73
73 -
 74
74 -
 75
75 -
 76
76 -
 77
77 -
 78
78 -
 79
79 -
 80
80 -
 81
81 -
82
-
83
-
84
-
85
-
86
-
87
-
88
-
89
-
90
-
91
-
92
-
93
-
94
-
95
-
96
-
97
-
98
-
99
-
100
-
101
-
102
-
103
-
104
-
105
-
106
-
107
-
108
-
109
-
110
-
111
-
112
-
113
-
114
-
115
-
116
-
117
-
118
-
119
-
120
-
121
-
122
-
123
-
124
-
125
-
126
-
127
-
128
-
129
-
130
-
131
-
132
-
133
-
134
-
135
-
136
-
137
-
138
-
139
-
140
 |
 |

Management’s Discussion (Continued)
Insurance—Underwriting (Continued)
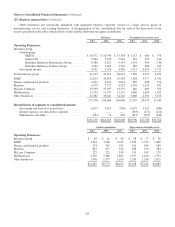
Underwriting results from our insurance businesses are summarized below. Amounts are in millions.
2013 2012 2011
Underwriting gain (loss) attributable to:
GEICO ....................................................................... $1,127 $ 680 $ 576
General Re .................................................................... 283 355 144
Berkshire Hathaway Reinsurance Group ............................................. 1,294 304 (714)
Berkshire Hathaway Primary Group ................................................ 385 286 242
Pre-tax underwriting gain ............................................................ 3,089 1,625 248
Income taxes and noncontrolling interests ................................................ 1,094 579 94
Net underwriting gain ....................................................... $1,995 $1,046 $ 154
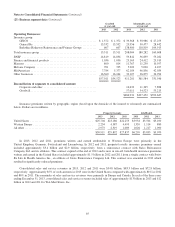
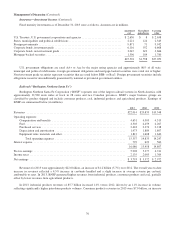
GEICO
Through GEICO, we primarily write private passenger automobile insurance, offering coverages to insureds in all 50 states
and the District of Columbia. GEICO’s policies are marketed mainly by direct response methods in which customers apply for
coverage directly to the company via the Internet or over the telephone. This is a significant element in our strategy to be a low-
cost auto insurer. In addition, we strive to provide excellent service to customers, with the goal of establishing long-term
customer relationships. GEICO’s underwriting results are summarized below. Dollars are in millions.
2013 2012 2011
Amount % Amount % Amount %
Premiums written ........................................... $19,083 $17,129 $15,664
Premiums earned ............................................ $18,572 100.0 $16,740 100.0 $15,363 100.0
Losses and loss adjustment expenses ............................ 14,255 76.7 12,700 75.9 12,013 78.2
Underwriting expenses ....................................... 3,190 17.2 3,360 20.0 2,774 18.1
Total losses and expenses ..................................... 17,445 93.9 16,060 95.9 14,787 96.3
Pre-tax underwriting gain ..................................... $ 1,127 $ 680 $ 576
Premiums written in 2013 were $19.1 billion, an increase of 11.4% over premiums written in 2012. Premiums earned in
2013 increased approximately $1.8 billion (10.9%) compared to premiums earned in 2012. The growth in premiums written and
earned reflected an increase in voluntary auto policies-in-force of 7.8% over the past year and, to a lesser degree, higher average
premiums per policy. The increase in policies-in-force reflected a 12.1% increase in voluntary auto new business sales.
Voluntary auto policies-in-force at December 31, 2013 were approximately 898,000 greater than at December 31, 2012.
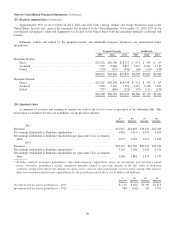
Losses and loss adjustment expenses incurred in 2013 increased $1.56 billion (12.2%) compared to 2012. The loss ratio
(the ratio of losses and loss adjustment expenses incurred to premiums earned) was 76.7% in 2013 compared to 75.9% in 2012.
In 2013, claims frequencies for property damage and collision coverages generally increased in the two to four percent range
compared to 2012. Physical damage claims severities increased in the three to four percent range in 2013. In addition, average
bodily injury claims frequencies increased in the one to two percent range. Bodily injury claims severities increased in the one
to three percent range, although severities for personal injury protection coverage declined, primarily in Florida. In both 2013
and 2012, losses and loss adjustment expenses incurred were favorably impacted by reductions of estimates for prior years’
losses.
Underwriting expenses incurred in 2013 declined $170 million (5.1%) compared with 2012. Underwriting expenses in
2012 were impacted by a change in U.S. GAAP concerning deferred policy acquisition costs (“DPAC”). DPAC represents the
69