Berkshire Hathaway 2013 Annual Report Download - page 92
Download and view the complete annual report
Please find page 92 of the 2013 Berkshire Hathaway annual report below. You can navigate through the pages in the report by either clicking on the pages listed below, or by using the keyword search tool below to find specific information within the annual report.-
 1
1 -
2
-
3
-
4
-
5
-
6
-
7
-
8
-
9
-
10
-
11
-
12
-
13
-
14
-
15
-
16
-
17
-
18
-
19
-
20
-
21
-
22
-
23
-
24
-
25
-
26
-
27
-
28
-
29
-
30
-
31
-
32
-
33
-
34
-
35
-
36
-
37
-
38
-
39
-
40
-
41
-
42
-
43
-
44
-
45
-
46
-
47
-
48
-
49
-
50
-
51
-
52
-
53
-
54
-
55
-
56
-
57
-
58
-
59
-
60
-
61
-
62
-
63
-
64
-
65
-
66
-
67
-
68
-
69
-
70
-
71
-
72
-
73
-
74
-
75
-
76
-
77
-
78
-
79
-
80
-
81
-
 82
82 -
 83
83 -
 84
84 -
 85
85 -
 86
86 -
 87
87 -
 88
88 -
 89
89 -
 90
90 -
 91
91 -
 92
92 -
 93
93 -
 94
94 -
 95
95 -
 96
96 -
 97
97 -
 98
98 -
 99
99 -
 100
100 -
 101
101 -
 102
102 -
103
-
104
-
105
-
106
-
107
-
108
-
109
-
110
-
111
-
112
-
113
-
114
-
115
-
116
-
117
-
118
-
119
-
120
-
121
-
122
-
123
-
124
-
125
-
126
-
127
-
128
-
129
-
130
-
131
-
132
-
133
-
134
-
135
-
136
-
137
-
138
-
139
-
140
 |
 |

Management’s Discussion (Continued)
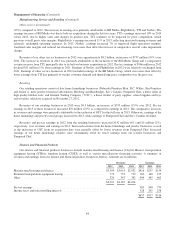
Contractual Obligations (Continued)
claim settlement activities or events that may occur over many years. In addition, obligations arising under life, annuity and
health insurance benefits are estimated based on assumptions as to future premiums, allowances, mortality, morbidity, expenses
and policy lapse rates, as applicable. The amounts presented in the following table are based on the liability estimates reflected
in our Consolidated Balance Sheet as of December 31, 2013. Although certain insurance losses and loss adjustment expenses
and life, annuity and health benefits are ceded to others under reinsurance contracts, receivables recorded in the Consolidated
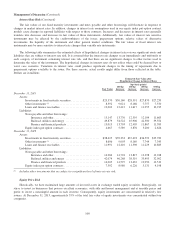
Balance Sheet are not reflected in the table below. A summary of contractual obligations as of December 31, 2013 follows.
Amounts are in millions.
Estimated payments due by period
Total 2014 2015-2016 2017-2018 After 2018
Notes payable and other borrowings (1) .......................... $113,862 $ 8,789 $14,521 $17,510 $ 73,042
Operating leases ............................................ 8,614 1,245 2,062 1,512 3,795
Purchase obligations ......................................... 50,297 15,496 10,541 7,295 16,965
Losses and loss adjustment expenses (2) .......................... 66,732 14,412 14,914 8,434 28,972
Life, annuity and health insurance benefits (3) ..................... 21,390 1,436 78 179 19,697
Other (4) ................................................... 20,768 5,304 1,496 1,190 12,778
Total ..................................................... $281,663 $46,682 $43,612 $36,120 $155,249
(1) Includes interest.
(2) Before reserve discounts of $1,866 million.
(3) Amounts represent estimated undiscounted benefit obligations net of estimated future premiums, as applicable.
(4) Includes derivative contract liabilities.
Critical Accounting Policies
Certain accounting policies require us to make estimates and judgments that affect the amounts reflected in the
Consolidated Financial Statements. Such estimates are necessarily based on assumptions about numerous factors involving
varying, and possibly significant, degrees of judgment and uncertainty. Accordingly, certain amounts currently recorded in the
financial statements, with the benefit of hindsight, will likely be adjusted in the future based on additional information made
available and changes in other facts and circumstances.
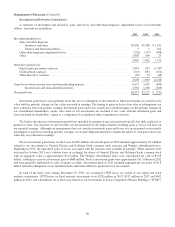
Property and casualty losses
A summary of our consolidated liabilities for unpaid property and casualty losses is presented in the table below. Except
for certain workers’ compensation liabilities, all liabilities for unpaid property and casualty losses (referred to in this section as
“gross unpaid losses”) are reflected in the Consolidated Balance Sheets without discounting for time value, regardless of the
length of the claim-tail. Amounts are in millions.
Gross unpaid losses Net unpaid losses *
Dec. 31, 2013 Dec. 31, 2012 Dec. 31, 2013 Dec. 31, 2012
GEICO ..................................................... $11,342 $10,300 $10,644 $ 9,791
General Re .................................................. 15,668 15,961 14,664 14,740
BHRG ..................................................... 30,446 31,186 25,314 26,328
Berkshire Hathaway Primary Group .............................. 7,410 6,713 6,737 6,171
Total ....................................................... $64,866 $64,160 $57,359 $57,030
* Net of reinsurance recoverable and deferred charges on reinsurance assumed and before foreign currency translation effects.
90