Berkshire Hathaway 2013 Annual Report Download - page 102
Download and view the complete annual report
Please find page 102 of the 2013 Berkshire Hathaway annual report below. You can navigate through the pages in the report by either clicking on the pages listed below, or by using the keyword search tool below to find specific information within the annual report.-
 1
1 -
2
-
3
-
4
-
5
-
6
-
7
-
8
-
9
-
10
-
11
-
12
-
13
-
14
-
15
-
16
-
17
-
18
-
19
-
20
-
21
-
22
-
23
-
24
-
25
-
26
-
27
-
28
-
29
-
30
-
31
-
32
-
33
-
34
-
35
-
36
-
37
-
38
-
39
-
40
-
41
-
42
-
43
-
44
-
45
-
46
-
47
-
48
-
49
-
50
-
51
-
52
-
53
-
54
-
55
-
56
-
57
-
58
-
59
-
60
-
61
-
62
-
63
-
64
-
65
-
66
-
67
-
68
-
69
-
70
-
71
-
72
-
73
-
74
-
75
-
76
-
77
-
78
-
79
-
80
-
81
-
82
-
83
-
84
-
85
-
86
-
87
-
88
-
89
-
90
-
91
-
 92
92 -
 93
93 -
 94
94 -
 95
95 -
 96
96 -
 97
97 -
 98
98 -
 99
99 -
 100
100 -
 101
101 -
 102
102 -
 103
103 -
 104
104 -
 105
105 -
 106
106 -
 107
107 -
 108
108 -
 109
109 -
 110
110 -
 111
111 -
 112
112 -
113
-
114
-
115
-
116
-
117
-
118
-
119
-
120
-
121
-
122
-
123
-
124
-
125
-
126
-
127
-
128
-
129
-
130
-
131
-
132
-
133
-
134
-
135
-
136
-
137
-
138
-
139
-
140
 |
 |

Management’s Discussion (Continued)
Interest Rate Risk (Continued)
The fair values of our fixed maturity investments and notes payable and other borrowings will fluctuate in response to
changes in market interest rates. In addition, changes in interest rate assumptions used in our equity index put option contract
models cause changes in reported liabilities with respect to those contracts. Increases and decreases in interest rates generally
translate into decreases and increases in fair values of those instruments. Additionally, fair values of interest rate sensitive
instruments may be affected by the creditworthiness of the issuer, prepayment options, relative values of alternative
investments, the liquidity of the instrument and other general market conditions. The fair values of fixed interest rate
instruments may be more sensitive to interest rate changes than variable rate instruments.
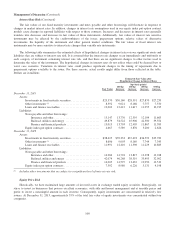
The following table summarizes the estimated effects of hypothetical changes in interest rates on our significant assets and
liabilities that are subject to interest rate risk. It is assumed that the interest rate changes occur immediately and uniformly to
each category of instrument containing interest rate risk, and that there are no significant changes to other factors used to
determine the value of the instrument. The hypothetical changes in interest rates do not reflect what could be deemed best or
worst case scenarios. Variations in interest rates could produce significant changes in the timing of repayments due to
prepayment options available to the issuer. For these reasons, actual results might differ from those reflected in the table.
Dollars are in millions.
Estimated Fair Value after
Hypothetical Change in Interest Rates
(bp=basis points)
Fair Value
100 bp
decrease
100 bp
increase
200 bp
increase
300 bp
increase
December 31, 2013
Assets:
Investments in fixed maturity securities .................... $29,370 $30,160 $28,591 $27,870 $27,259
Other investments (1) .................................. 8,592 9,021 8,166 7,757 7,370
Loans and finance receivables ........................... 12,002 12,412 11,617 11,255 10,915
Liabilities:
Notes payable and other borrowings:
Insurance and other ................................ 13,147 13,776 12,595 12,104 11,663
Railroad, utilities and energy ........................ 49,879 54,522 45,906 42,500 39,554
Finance and financial products ....................... 13,013 13,703 12,405 11,867 11,385
Equity index put option contracts ......................... 4,667 5,589 3,876 3,200 2,626
December 31, 2012
Assets:
Investments in fixed maturity securities .................... $38,425 $39,333 $37,493 $36,592 $35,783
Other investments (1) .................................. 8,606 9,003 8,169 7,744 7,343
Loans and finance receivables ........................... 11,991 12,410 11,598 11,229 10,883
Liabilities:
Notes payable and other borrowings:
Insurance and other ................................ 14,284 14,794 13,815 13,398 13,018
Railroad, utilities and energy ........................ 42,074 46,268 38,519 35,495 32,902
Finance and financial products ....................... 14,005 14,597 13,432 12,950 12,519
Equity index put option contracts ......................... 7,502 8,980 6,226 5,131 4,198
(1) Includes other investments that are subject to a significant level of interest rate risk.
Equity Price Risk
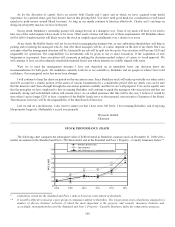
Historically, we have maintained large amounts of invested assets in exchange traded equity securities. Strategically, we
strive to invest in businesses that possess excellent economics, with able and honest management and at sensible prices and
prefer to invest a meaningful amount in each investee. Consequently, equity investments are concentrated in relatively few
issuers. At December 31, 2013, approximately 55% of the total fair value of equity investments was concentrated within four
companies.
100