Berkshire Hathaway 2013 Annual Report Download - page 18
Download and view the complete annual report
Please find page 18 of the 2013 Berkshire Hathaway annual report below. You can navigate through the pages in the report by either clicking on the pages listed below, or by using the keyword search tool below to find specific information within the annual report.-
 1
1 -
2
-
3
-
4
-
5
-
6
-
7
-
 8
8 -
 9
9 -
 10
10 -
 11
11 -
 12
12 -
 13
13 -
 14
14 -
 15
15 -
 16
16 -
 17
17 -
 18
18 -
 19
19 -
 20
20 -
 21
21 -
 22
22 -
 23
23 -
 24
24 -
 25
25 -
 26
26 -
 27
27 -
 28
28 -
29
-
30
-
31
-
32
-
33
-
34
-
35
-
36
-
37
-
38
-
39
-
40
-
41
-
42
-
43
-
44
-
45
-
46
-
47
-
48
-
49
-
50
-
51
-
52
-
53
-
54
-
55
-
56
-
57
-
58
-
59
-
60
-
61
-
62
-
63
-
64
-
65
-
66
-
67
-
68
-
69
-
70
-
71
-
72
-
73
-
74
-
75
-
76
-
77
-
78
-
79
-
80
-
81
-
82
-
83
-
84
-
85
-
86
-
87
-
88
-
89
-
90
-
91
-
92
-
93
-
94
-
95
-
96
-
97
-
98
-
99
-
100
-
101
-
102
-
103
-
104
-
105
-
106
-
107
-
108
-
109
-
110
-
111
-
112
-
113
-
114
-
115
-
116
-
117
-
118
-
119
-
120
-
121
-
122
-
123
-
124
-
125
-
126
-
127
-
128
-
129
-
130
-
131
-
132
-
133
-
134
-
135
-
136
-
137
-
138
-
139
-
140
 |
 |

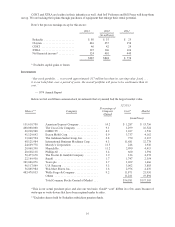
CORT and XTRA are leaders in their industries as well. And Jeff Pederson and Bill Franz will keep them
on top. We are backing their plans through purchases of equipment that enlarge their rental potential.
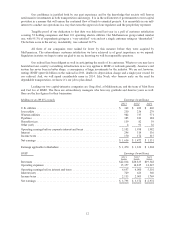
Here’s the pre-tax earnings recap for this sector:
2013 2012 2011
(in millions)
Berkadia ..................... $ 80 $ 35 $ 25
Clayton ...................... 416 255 154
CORT ....................... 40 42 29
XTRA ....................... 125 106 126
Net financial income* ........... 324 410 440
$985 $848 $ 774
* Excludes capital gains or losses
Investments
“Our stock portfolio . . . was worth approximately $17 million less than its carrying value [cost] . . .
it is our belief that, over a period of years, the overall portfolio will prove to be worth more than its
cost.”
— 1974 Annual Report
Below we list our fifteen common stock investments that at yearend had the largest market value.
12/31/13
Shares** Company
Percentage of
Company
Owned
Cost* Market
(in millions)
151,610,700 American Express Company ............. 14.2 $ 1,287 $ 13,756
400,000,000 The Coca-Cola Company ............... 9.1 1,299 16,524
22,238,900 DIRECTV ........................... 4.2 1,017 1,536
41,129,643 Exxon Mobil Corp. .................... 0.9 3,737 4,162
13,062,594 The Goldman Sachs Group, Inc. .......... 2.8 750 2,315
68,121,984 International Business Machines Corp. ..... 6.3 11,681 12,778
24,669,778 Moody’s Corporation .................. 11.5 248 1,936
20,060,390 Munich Re ........................... 11.2 2,990 4,415
20,668,118 Phillips 66 ........................... 3.4 660 1,594
52,477,678 The Procter & Gamble Company ......... 1.9 336 4,272
22,169,930 Sanofi .............................. 1.7 1,747 2,354
301,046,076 Tesco plc ............................ 3.7 1,699 1,666
96,117,069 U.S. Bancorp ......................... 5.3 3,002 3,883
56,805,984 Wal-Mart Stores, Inc. .................. 1.8 2,976 4,470
483,470,853 Wells Fargo & Company ................ 9.2 11,871 21,950
Others .............................. 11,281 19,894
Total Common Stocks Carried at Market . . . $56,581 $117,505
*This is our actual purchase price and also our tax basis; GAAP “cost” differs in a few cases because of
write-ups or write-downs that have been required under its rules.
**Excludes shares held by Berkshire subsidiary pension funds.
16