Berkshire Hathaway 2013 Annual Report Download - page 16
Download and view the complete annual report
Please find page 16 of the 2013 Berkshire Hathaway annual report below. You can navigate through the pages in the report by either clicking on the pages listed below, or by using the keyword search tool below to find specific information within the annual report.-
 1
1 -
2
-
3
-
4
-
5
-
 6
6 -
 7
7 -
 8
8 -
 9
9 -
 10
10 -
 11
11 -
 12
12 -
 13
13 -
 14
14 -
 15
15 -
 16
16 -
 17
17 -
 18
18 -
 19
19 -
 20
20 -
 21
21 -
 22
22 -
 23
23 -
 24
24 -
 25
25 -
 26
26 -
27
-
28
-
29
-
30
-
31
-
32
-
33
-
34
-
35
-
36
-
37
-
38
-
39
-
40
-
41
-
42
-
43
-
44
-
45
-
46
-
47
-
48
-
49
-
50
-
51
-
52
-
53
-
54
-
55
-
56
-
57
-
58
-
59
-
60
-
61
-
62
-
63
-
64
-
65
-
66
-
67
-
68
-
69
-
70
-
71
-
72
-
73
-
74
-
75
-
76
-
77
-
78
-
79
-
80
-
81
-
82
-
83
-
84
-
85
-
86
-
87
-
88
-
89
-
90
-
91
-
92
-
93
-
94
-
95
-
96
-
97
-
98
-
99
-
100
-
101
-
102
-
103
-
104
-
105
-
106
-
107
-
108
-
109
-
110
-
111
-
112
-
113
-
114
-
115
-
116
-
117
-
118
-
119
-
120
-
121
-
122
-
123
-
124
-
125
-
126
-
127
-
128
-
129
-
130
-
131
-
132
-
133
-
134
-
135
-
136
-
137
-
138
-
139
-
140
 |
 |
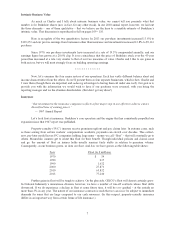
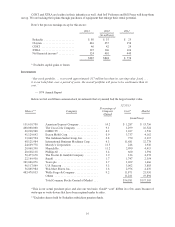
I won’t explain all of the adjustments – some are tiny and arcane – but serious investors should understand
the disparate nature of intangible assets: Some truly deplete over time while others in no way lose value. With
software, for example, amortization charges are very real expenses. Charges against other intangibles such as the
amortization of customer relationships, however, arise through purchase-accounting rules and are clearly not real
costs. GAAP accounting draws no distinction between the two types of charges. Both, that is, are recorded as expenses
when earnings are calculated – even though from an investor’s viewpoint they could not be more different.
In the GAAP-compliant figures we show on page 29, amortization charges of $648 million for the
companies included in this section are deducted as expenses. We would call about 20% of these “real,” the rest not.
This difference has become significant because of the many acquisitions we have made. It will almost certainly rise
further as we acquire more companies.
Eventually, of course, the non-real charges disappear when the assets to which they’re related become
fully amortized. But this usually takes 15 years and – alas – it will be my successor whose reported earnings get the
benefit of their expiration.
Every dime of depreciation expense we report, however, is a real cost. And that’s true at almost all other
companies as well. When Wall Streeters tout EBITDA as a valuation guide, button your wallet.
Our public reports of earnings will, of course, continue to conform to GAAP. To embrace reality,
however, remember to add back most of the amortization charges we report.
************
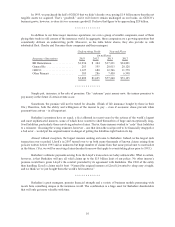
The crowd of companies in this section sells products ranging from lollipops to jet airplanes. Some of
these businesses, measured by earnings on unleveraged net tangible assets, enjoy terrific economics, producing
profits that run from 25% after-tax to far more than 100%. Others generate good returns in the area of 12% to 20%.
A few, however, have very poor returns, a result of some serious mistakes I made in my job of capital allocation. I
was not misled: I simply was wrong in my evaluation of the economic dynamics of the company or the industry in
which it operated.
Fortunately, my blunders usually involved relatively small acquisitions. Our large buys have generally
worked out well and, in a few cases, more than well. I have not, however, made my last mistake in purchasing
either businesses or stocks. Not everything works out as planned.
Viewed as a single entity, the companies in this group are an excellent business. They employed an
average of $25 billion of net tangible assets during 2013 and, with large quantities of excess cash and little
leverage, earned 16.7% after-tax on that capital.
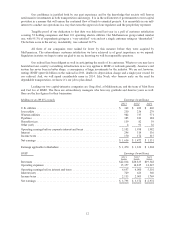
Of course, a business with terrific economics can be a bad investment if the purchase price is excessive.
We have paid substantial premiums to net tangible assets for most of our businesses, a cost that is reflected in the
large figure we show for goodwill. Overall, however, we are getting a decent return on the capital we have
deployed in this sector. Furthermore, the intrinsic value of these businesses, in aggregate, exceeds their carrying
value by a good margin. Even so, the difference between intrinsic value and carrying value in the insurance and
regulated-industry segments is far greater. It is there that the truly big winners reside.
************
We have far too many companies in this group to comment on them individually. Moreover, both current
and potential competitors read this report. In a few of our businesses we might be disadvantaged if they knew our
numbers. So, in some of our operations that are not of a size material to an evaluation of Berkshire, we only
disclose what is required. You can find a good bit of detail about many of our operations, however, on pages 80-84.
14