Berkshire Hathaway 2013 Annual Report Download - page 80
Download and view the complete annual report
Please find page 80 of the 2013 Berkshire Hathaway annual report below. You can navigate through the pages in the report by either clicking on the pages listed below, or by using the keyword search tool below to find specific information within the annual report.-
 1
1 -
2
-
3
-
4
-
5
-
6
-
7
-
8
-
9
-
10
-
11
-
12
-
13
-
14
-
15
-
16
-
17
-
18
-
19
-
20
-
21
-
22
-
23
-
24
-
25
-
26
-
27
-
28
-
29
-
30
-
31
-
32
-
33
-
34
-
35
-
36
-
37
-
38
-
39
-
40
-
41
-
42
-
43
-
44
-
45
-
46
-
47
-
48
-
49
-
50
-
51
-
52
-
53
-
54
-
55
-
56
-
57
-
58
-
59
-
60
-
61
-
62
-
63
-
64
-
65
-
66
-
67
-
68
-
69
-
 70
70 -
 71
71 -
 72
72 -
 73
73 -
 74
74 -
 75
75 -
 76
76 -
 77
77 -
 78
78 -
 79
79 -
 80
80 -
 81
81 -
 82
82 -
 83
83 -
 84
84 -
 85
85 -
 86
86 -
 87
87 -
 88
88 -
 89
89 -
 90
90 -
91
-
92
-
93
-
94
-
95
-
96
-
97
-
98
-
99
-
100
-
101
-
102
-
103
-
104
-
105
-
106
-
107
-
108
-
109
-
110
-
111
-
112
-
113
-
114
-
115
-
116
-
117
-
118
-
119
-
120
-
121
-
122
-
123
-
124
-
125
-
126
-
127
-
128
-
129
-
130
-
131
-
132
-
133
-
134
-
135
-
136
-
137
-
138
-
139
-
140
 |
 |

Management’s Discussion (Continued)
Utilities and Energy (“MidAmerican”) (Continued)
PacifiCorp, MidAmerican Energy Company (“MEC”), as well as Nevada Power Company and Sierra Pacific Power Company
(together, “NV Energy”). NV Energy was acquired on December 19, 2013. MidAmerican also owns two domestic regulated
interstate natural gas pipeline companies. In Great Britain, MidAmerican subsidiaries operate two regulated electricity
distribution businesses referred to as Northern Powergrid. The rates that our regulated businesses charge customers for energy
and services are based in large part on the costs of business operations, including a return on capital, and are subject to
regulatory approval. To the extent these operations are not allowed to include such costs in the approved rates, operating results
will be adversely affected. In addition, MidAmerican also operates a diversified portfolio of independent power projects and the
second-largest residential real estate brokerage firm and franchise network in the United States.
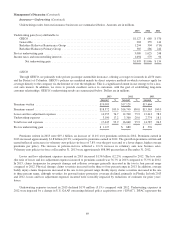
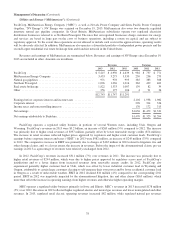
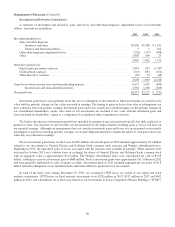
Revenues and earnings of MidAmerican are summarized below. Revenues and earnings of NV Energy since December 19,
2013 are included in other. Amounts are in millions.
Revenues Earnings
2013 2012 2011 2013 2012 2011
PacifiCorp .............................................. $ 5,215 $ 4,950 $ 4,639 $ 982 $ 737 $ 771
MidAmerican Energy Company ............................. 3,453 3,275 3,530 230 236 279
Natural gas pipelines ...................................... 971 978 993 385 383 388
Northern Powergrid ....................................... 1,026 1,036 1,016 362 429 469
Real estate brokerage ..................................... 1,822 1,333 1,007 139 82 39
Other .................................................. 256 175 106 4 91 36
$12,743 $11,747 $11,291
Earnings before corporate interest and income taxes ............. 2,102 1,958 1,982
Corporate interest ........................................ 296 314 336
Income taxes and noncontrolling interests ..................... 170 172 315
Net earnings ............................................. $1,636 $1,472 $1,331
Net earnings attributable to Berkshire ......................... $1,470 $1,323 $1,204
PacifiCorp operates a regulated utility business in portions of several Western states, including Utah, Oregon and
Wyoming. PacifiCorp’s revenues in 2013 were $5.2 billion, an increase of $265 million (5%) compared to 2012. The increase
was primarily due to higher retail revenues of $337 million, partially offset by lower renewable energy credits ($74 million).
The increase in retail revenues reflected higher prices approved by regulators and higher retail customer loads. PacifiCorp’s
earnings before corporate interest and taxes (“EBIT”) in 2013 were $982 million, an increase of $245 million (33%) compared
to 2012. The comparative increase in EBIT was primarily due to charges of $165 million in 2012 related to litigation, fire and
other damage claims, and, to a lesser extent, the increase in revenues. Before the impact of the aforementioned claims, pre-tax
earnings in 2013 as a percentage of revenues were relatively unchanged from 2012.
In 2012, PacifiCorp’s revenues increased $311 million (7%) over revenues in 2011. The increase was primarily due to
higher retail revenues of $244 million, which were due to higher prices approved by regulators across most of PacifiCorp’s
jurisdictions and to a lesser degree from increased revenues from renewable energy credits. In 2012, PacifiCorp also
experienced generally higher customer load in Utah, which was offset by lower industrial customer load in Wyoming and
Oregon, attributable to certain large customers electing to self-generate their own power and by lower residential customer load
in Oregon as a result of unfavorable weather. EBIT in 2012 declined $34 million (4%) compared to the corresponding 2011
period. EBIT in 2012 was negatively impacted by the aforementioned litigation, fire and other claims ($165 million), which
more than offset the increase in operating earnings from higher revenues and otherwise higher operating margins.
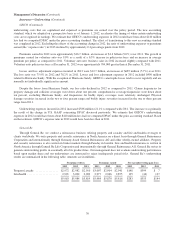
MEC operates a regulated utility business primarily in Iowa and Illinois. MEC’s revenues in 2013 increased $178 million
(5%) over 2012. Revenues in 2013 reflected higher regulated electric and natural gas revenues and lower nonregulated and other
revenues. In 2013, regulated retail electric operating revenues increased $82 million, while regulated natural gas revenues
78