Berkshire Hathaway 2013 Annual Report Download - page 73
Download and view the complete annual report
Please find page 73 of the 2013 Berkshire Hathaway annual report below. You can navigate through the pages in the report by either clicking on the pages listed below, or by using the keyword search tool below to find specific information within the annual report.-
 1
1 -
2
-
3
-
4
-
5
-
6
-
7
-
8
-
9
-
10
-
11
-
12
-
13
-
14
-
15
-
16
-
17
-
18
-
19
-
20
-
21
-
22
-
23
-
24
-
25
-
26
-
27
-
28
-
29
-
30
-
31
-
32
-
33
-
34
-
35
-
36
-
37
-
38
-
39
-
40
-
41
-
42
-
43
-
44
-
45
-
46
-
47
-
48
-
49
-
50
-
51
-
52
-
53
-
54
-
55
-
56
-
57
-
58
-
59
-
60
-
61
-
62
-
 63
63 -
 64
64 -
 65
65 -
 66
66 -
 67
67 -
 68
68 -
 69
69 -
 70
70 -
 71
71 -
 72
72 -
 73
73 -
 74
74 -
 75
75 -
 76
76 -
 77
77 -
 78
78 -
 79
79 -
 80
80 -
 81
81 -
 82
82 -
 83
83 -
84
-
85
-
86
-
87
-
88
-
89
-
90
-
91
-
92
-
93
-
94
-
95
-
96
-
97
-
98
-
99
-
100
-
101
-
102
-
103
-
104
-
105
-
106
-
107
-
108
-
109
-
110
-
111
-
112
-
113
-
114
-
115
-
116
-
117
-
118
-
119
-
120
-
121
-
122
-
123
-
124
-
125
-
126
-
127
-
128
-
129
-
130
-
131
-
132
-
133
-
134
-
135
-
136
-
137
-
138
-
139
-
140
 |
 |
Management’s Discussion (Continued)
Insurance—Underwriting (Continued)
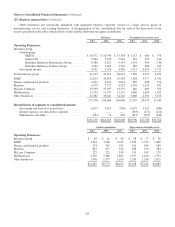
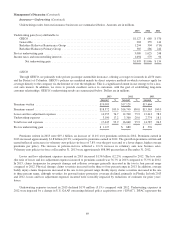
Property/casualty
Property/casualty premiums written in 2013 were relatively unchanged while premiums earned increased $103 million
(3.5%), versus the corresponding 2012 period. Excluding the effects of foreign currency exchange rate changes, premiums
written and premiums earned in 2013 increased $8 million (0.3%) and $83 million (2.9%), respectively, versus 2012. This was
primarily due to increases in European treaty business. Price competition in most property and casualty lines persists. Our
underwriters continue to exercise discipline by declining offers to write business where prices are deemed inadequate. We
remain prepared to increase premium volumes should market conditions improve.
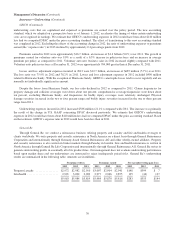
Property/casualty operations in 2013 produced net underwriting gains of $148 million which consisted of $153 million of
gains from our property business and $5 million of losses from casualty/workers’ compensation business. In 2013, property
results included catastrophe losses of approximately $400 million attributable to a hailstorm ($280 million) and floods ($120
million) in Europe. The timing and magnitude of catastrophe and large individual losses has produced and is expected to
continue to produce significant volatility in periodic underwriting results. Property underwriting results also included gains from
reductions of $375 million in loss reserve estimates for prior years’ loss events as a result of lower than expected losses reported
from ceding companies. The underwriting loss from casualty/workers’ compensation business included $141 million of losses
attributable to discount accretion related to prior years’ workers’ compensation liabilities and net underwriting losses
attributable to current year business, offset by reductions in estimated liabilities for prior year losses.
Premiums written in 2012 increased $72 million (2.5%), while premiums earned declined $37 million (1.3%) from 2011.
Excluding the effects of foreign currency exchange rate changes, premiums written increased $158 million (5.4%) compared to
2011 which reflected increased volume in most of our major markets around the globe. Before the effects of currency exchange,
premiums earned in 2012 increased $61 million (2.1%) over 2011 which was primarily attributable to an increase in European
property treaty business.
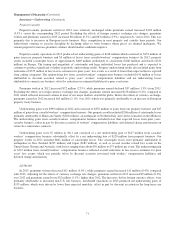
Underwriting gains were $399 million in 2012 and consisted of $352 million of gains from our property business and $47
million of gains from casualty/workers’ compensation business. Our property results included $266 million of catastrophe losses
primarily attributable to Hurricane Sandy ($226 million), an earthquake in Northern Italy and various tornadoes in the Midwest.
The underwriting gains from casualty/workers’ compensation business included lower than expected losses from prior years’
casualty business, offset in part by discount accretion of workers’ compensation liabilities and deferred charge amortization on
retroactive reinsurance contracts.
Underwriting gains were $7 million in 2011 and consisted of a net underwriting gain of $127 million from casualty/
workers’ compensation business substantially offset by a net underwriting loss of $120 million from property business. Our
property results in 2011 included $861 million of catastrophe losses. The catastrophe losses were primarily attributable to
earthquakes in New Zealand ($235 million) and Japan ($189 million), as well as several weather related loss events in the
United States, Europe and Australia, with losses ranging from about $30 million to $75 million per event. The underwriting gain
of $127 million from casualty/workers’ compensation business reflected overall reductions in loss reserve estimates for prior
years’ loss events, which was partially offset by discount accretion associated with workers’ compensation liabilities and
deferred charge amortization.
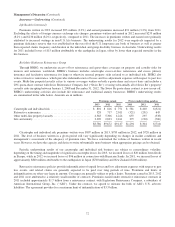
Life/health
In 2013, premiums written decreased $11 million (0.4%), while premiums earned increased $11 million (0.4%) compared
with 2012. Adjusting for the effects of currency exchange rate changes, premiums written in 2013 increased $9 million (0.3%)
over 2012 and premiums earned were $32 million (1.1%), higher than 2012. The increases, before foreign currency effects, were
primarily attributable to increased non-U.S. life business. Life/health operations in 2013 produced net underwriting gains of
$135 million, which were driven by lower than expected mortality, offset in part by discount accretion in the long-term care
business.
71