Berkshire Hathaway 2013 Annual Report Download - page 46
Download and view the complete annual report
Please find page 46 of the 2013 Berkshire Hathaway annual report below. You can navigate through the pages in the report by either clicking on the pages listed below, or by using the keyword search tool below to find specific information within the annual report.-
 1
1 -
2
-
3
-
4
-
5
-
6
-
7
-
8
-
9
-
10
-
11
-
12
-
13
-
14
-
15
-
16
-
17
-
18
-
19
-
20
-
21
-
22
-
23
-
24
-
25
-
26
-
27
-
28
-
29
-
30
-
31
-
32
-
33
-
34
-
35
-
 36
36 -
 37
37 -
 38
38 -
 39
39 -
 40
40 -
 41
41 -
 42
42 -
 43
43 -
 44
44 -
 45
45 -
 46
46 -
 47
47 -
 48
48 -
 49
49 -
 50
50 -
 51
51 -
 52
52 -
 53
53 -
 54
54 -
 55
55 -
 56
56 -
57
-
58
-
59
-
60
-
61
-
62
-
63
-
64
-
65
-
66
-
67
-
68
-
69
-
70
-
71
-
72
-
73
-
74
-
75
-
76
-
77
-
78
-
79
-
80
-
81
-
82
-
83
-
84
-
85
-
86
-
87
-
88
-
89
-
90
-
91
-
92
-
93
-
94
-
95
-
96
-
97
-
98
-
99
-
100
-
101
-
102
-
103
-
104
-
105
-
106
-
107
-
108
-
109
-
110
-
111
-
112
-
113
-
114
-
115
-
116
-
117
-
118
-
119
-
120
-
121
-
122
-
123
-
124
-
125
-
126
-
127
-
128
-
129
-
130
-
131
-
132
-
133
-
134
-
135
-
136
-
137
-
138
-
139
-
140
 |
 |

Notes to Consolidated Financial Statements (Continued)
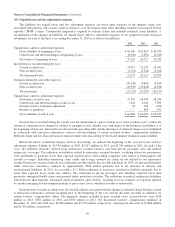
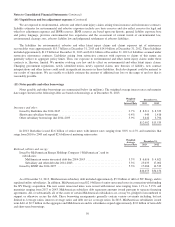
(6) Investments in H.J. Heinz Holding Corporation (Continued)
We have concluded that our investment in Preferred Stock represents an equity investment and it is carried at cost in our
Consolidated Balance Sheet. The combined carrying value of our investments in Heinz Holding was $12.1 billion as of
December 31, 2013. Dividends earned in connection with the Preferred Stock and our share of Heinz Holding’s net loss
attributable to common stockholders are included in interest, dividend and other investment income of Insurance and Other in
the Consolidated Statement of Earnings.
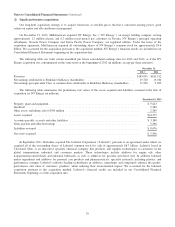
Summarized consolidated financial information of Heinz Holding and its subsidiaries follows (in millions).
As of December 29,
2013
Assets ................................................................ $38,972
Liabilities ............................................................. 22,429
For the period
June 7, 2013 through
December 29, 2013
Sales ................................................................. $ 6,240
Net loss .............................................................. $ (77)
Preferred stock dividends earned by Berkshire ................................ (408)
Net loss attributable to common stockholders ................................. $ (485)
Earnings attributable to Berkshire * ........................................ $ 153
* Includes dividends earned less Berkshire’s share of net loss attributable to common stockholders.
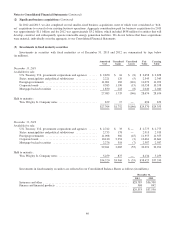
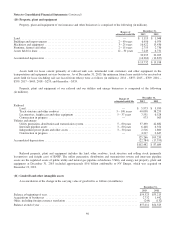
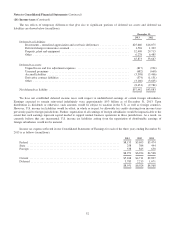
(7) Investment gains/losses
Investment gains/losses, including other-than-temporary impairment (“OTTI”) losses, for each of the three years ending
December 31, 2013 are summarized below (in millions).
2013 2012 2011
Fixed maturity securities —
Gross gains from sales and other disposals .......................................... $1,783 $ 188 $ 310
Gross losses from sales and other disposals .......................................... (139) (354) (10)
Equity securities —
Gross gains from sales and redemptions ............................................ 1,253 1,468 1,889
Gross losses from sales and redemptions ............................................ (62) (12) (36)
OTTI losses ...................................................................... (228) (337) (908)
Other ............................................................................ 1,458 509 29
$4,065 $1,462 $1,274
Investment gains from fixed maturity investments in 2013 included a gain of $680 million related to Mars/Wrigley’s
repurchase of the Wrigley subordinated notes as well as gains from the dispositions and conversions of corporate bonds. Other
investment gains/losses in 2013 included $1.4 billion related to the changes in the valuations of the GE and GS warrants.
Investment gains from equity securities in 2011 included $1.8 billion with respect to the redemptions of our GS and GE
preferred stock investments.
We record investments in equity and fixed maturity securities classified as available-for-sale at fair value and record the
difference between fair value and cost in other comprehensive income. OTTI losses recognized in earnings represent reductions
44