Berkshire Hathaway 2013 Annual Report Download - page 48
Download and view the complete annual report
Please find page 48 of the 2013 Berkshire Hathaway annual report below. You can navigate through the pages in the report by either clicking on the pages listed below, or by using the keyword search tool below to find specific information within the annual report.-
 1
1 -
2
-
3
-
4
-
5
-
6
-
7
-
8
-
9
-
10
-
11
-
12
-
13
-
14
-
15
-
16
-
17
-
18
-
19
-
20
-
21
-
22
-
23
-
24
-
25
-
26
-
27
-
28
-
29
-
30
-
31
-
32
-
33
-
34
-
35
-
36
-
37
-
 38
38 -
 39
39 -
 40
40 -
 41
41 -
 42
42 -
 43
43 -
 44
44 -
 45
45 -
 46
46 -
 47
47 -
 48
48 -
 49
49 -
 50
50 -
 51
51 -
 52
52 -
 53
53 -
 54
54 -
 55
55 -
 56
56 -
 57
57 -
 58
58 -
59
-
60
-
61
-
62
-
63
-
64
-
65
-
66
-
67
-
68
-
69
-
70
-
71
-
72
-
73
-
74
-
75
-
76
-
77
-
78
-
79
-
80
-
81
-
82
-
83
-
84
-
85
-
86
-
87
-
88
-
89
-
90
-
91
-
92
-
93
-
94
-
95
-
96
-
97
-
98
-
99
-
100
-
101
-
102
-
103
-
104
-
105
-
106
-
107
-
108
-
109
-
110
-
111
-
112
-
113
-
114
-
115
-
116
-
117
-
118
-
119
-
120
-
121
-
122
-
123
-
124
-
125
-
126
-
127
-
128
-
129
-
130
-
131
-
132
-
133
-
134
-
135
-
136
-
137
-
138
-
139
-
140
 |
 |

Notes to Consolidated Financial Statements (Continued)
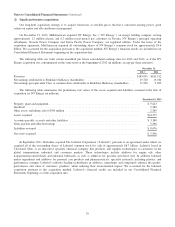
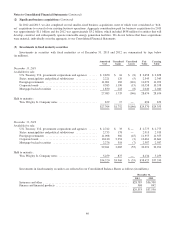
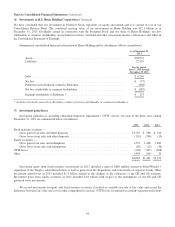
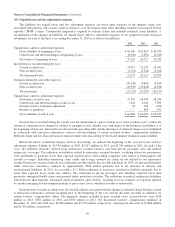
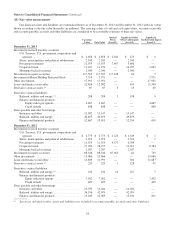
(10) Property, plant and equipment
Property, plant and equipment of our insurance and other businesses is comprised of the following (in millions).
Ranges of
estimated useful life
December 31,
2013 2012
Land ................................................................. — $ 1,115 $ 1,048
Buildings and improvements .............................................. 2–40years 6,456 6,074
Machinery and equipment ................................................ 3–25years 16,422 15,436
Furniture, fixtures and other .............................................. 2–15years 2,753 2,736
Assets held for lease .................................................... 12–30years 7,249 6,731
33,995 32,025
Accumulated depreciation ................................................ (14,263) (12,837)
$ 19,732 $ 19,188
Assets held for lease consist primarily of railroad tank cars, intermodal tank containers and other equipment in the
transportation and equipment services businesses. As of December 31, 2013, the minimum future lease rentals to be received on
assets held for lease (including rail cars leased from others) were as follows (in millions): 2014 – $855; 2015 – $709; 2016 –
$559; 2017 – $405; 2018 – $253; and thereafter – $333.
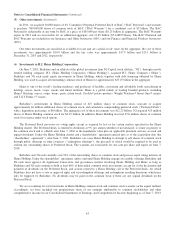
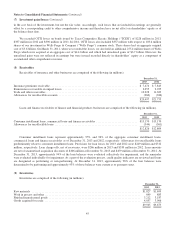
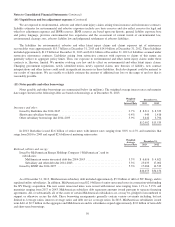
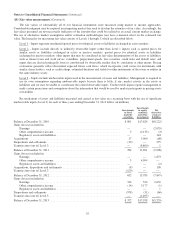
Property, plant and equipment of our railroad and our utilities and energy businesses is comprised of the following
(in millions).
Ranges of
estimated useful life
December 31,
2013 2012
Railroad:
Land ............................................................ — $ 5,973 $ 5,950
Track structure and other roadway .................................... 5–100years 40,098 38,255
Locomotives, freight cars and other equipment .......................... 5–37years 7,551 6,528
Construction in progress ............................................ — 973 963
Utilities and energy:
Utility generation, distribution and transmission system ................... 5–80years 57,490 42,682
Interstate pipeline assets ............................................ 3–80years 6,448 6,354
Independent power plants and other assets .............................. 3–30years 2,516 1,860
Construction in progress ............................................ — 4,217 2,647
125,266 105,239
Accumulated depreciation ............................................... (22,784) (17,555)
$102,482 $ 87,684
Railroad property, plant and equipment includes the land, other roadway, track structure and rolling stock (primarily
locomotives and freight cars) of BNSF. The utility generation, distribution and transmission system and interstate pipeline
assets are the regulated assets of public utility and natural gas pipeline subsidiaries. Utility and energy net property, plant and
equipment at December 31, 2013 included approximately $9.6 billion attributable to NV Energy, which was acquired on
December 19, 2013.
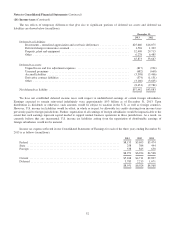
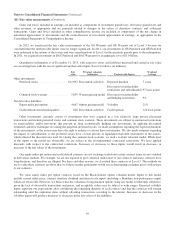
(11) Goodwill and other intangible assets
A reconciliation of the change in the carrying value of goodwill is as follows (in millions).
December 31,
2013 2012
Balance at beginning of year ............................................................... $54,523 $53,213
Acquisitions of businesses ................................................................ 2,732 1,442
Other, including foreign currency translation .................................................. (244) (132)
Balance at end of year .................................................................... $57,011 $54,523
46