Aflac 2009 Annual Report Download - page 95
Download and view the complete annual report
Please find page 95 of the 2009 Aflac annual report below. You can navigate through the pages in the report by either clicking on the pages listed below, or by using the keyword search tool below to find specific information within the annual report.-
 1
1 -
2
-
3
-
4
-
5
-
6
-
7
-
8
-
9
-
10
-
11
-
12
-
13
-
14
-
15
-
16
-
17
-
18
-
19
-
20
-
21
-
22
-
23
-
24
-
25
-
26
-
27
-
28
-
29
-
30
-
31
-
32
-
33
-
34
-
35
-
36
-
37
-
38
-
39
-
40
-
41
-
42
-
43
-
44
-
45
-
46
-
47
-
48
-
49
-
50
-
51
-
52
-
53
-
54
-
55
-
56
-
57
-
58
-
59
-
60
-
61
-
62
-
63
-
64
-
65
-
66
-
67
-
68
-
69
-
70
-
71
-
72
-
73
-
74
-
75
-
76
-
77
-
78
-
79
-
80
-
81
-
82
-
83
-
84
-
 85
85 -
 86
86 -
 87
87 -
 88
88 -
 89
89 -
 90
90 -
 91
91 -
 92
92 -
 93
93 -
 94
94 -
 95
95 -
 96
96 -
 97
97 -
 98
98
 |
 |
Aflac Annual Report for 2009 91
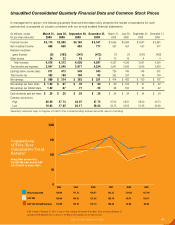
Unaudited Consolidated Quarterly Financial Data and Common Stock Prices
In management’s opinion, the following quarterly nancial information fairly presents the results of operations for such
periods and is prepared on a basis consistent with our annual audited nancial statements.
(In millions, except March 31, June 30, September 30, December 31, March 31, June 30, September 30, December 31,
for per-share amounts) 2009 2009 2009 2009 2008 2008 2008 2008
Premium income $ 4,115 $ 3,995 $ 4,165 $ 4,347 $ 3,635 $ 3,684 $ 3,647 $ 3,981
Net investment income 688 668 692 717 627 637 637 677
Realized investment
gains (losses) (9) (383) (347) (472) (7) (1) (597) (402)
Other income 24 33 16 5 12 16 4 4
Total revenues 4,818 4,313 4,526 4,597 4,267 4,336 3,691 4,260
Total benefits and expenses 3,947 3,840 3,977 4,254 3,541 3,596 3,543 3,959
Earnings before income taxes 871 473 549 343 726 740 148 301
Total income tax 302 159 186 92 252 257 48 104
Net earnings $ 569 $ 314 $ 363 $ 251 $ 474 $ 483 $ 100 $ 197
Net earnings per basic share $ 1.22 $ .67 $ .78 $ .54 $ .99 $ 1.02 $ .21 $ .42
Net earnings per diluted share 1.22 .67 .77 .53 .98 1.00 .21 .42
Cash dividends paid per share $ .28 $ .28 $ .28 $ .28 $ .24 $ .24 $ .24 $ .24
Common stock prices:
High 46.96 37.73 44.07 47.75 67.00 68.81 68.00 60.73
Low 10.83 17.25 28.17 39.82 56.75 62.52 51.25 29.68
Quarterly amounts may not agree in total to the corresponding annual amounts due to rounding.
*$100 invested on December 31, 2004, in stock or index, including reinvestment of dividends. Fiscal year ending December 31.
Copyright © 2009 Standard & Poor’s, a division of The McGraw-Hill Companies, Inc. All rights reserved.
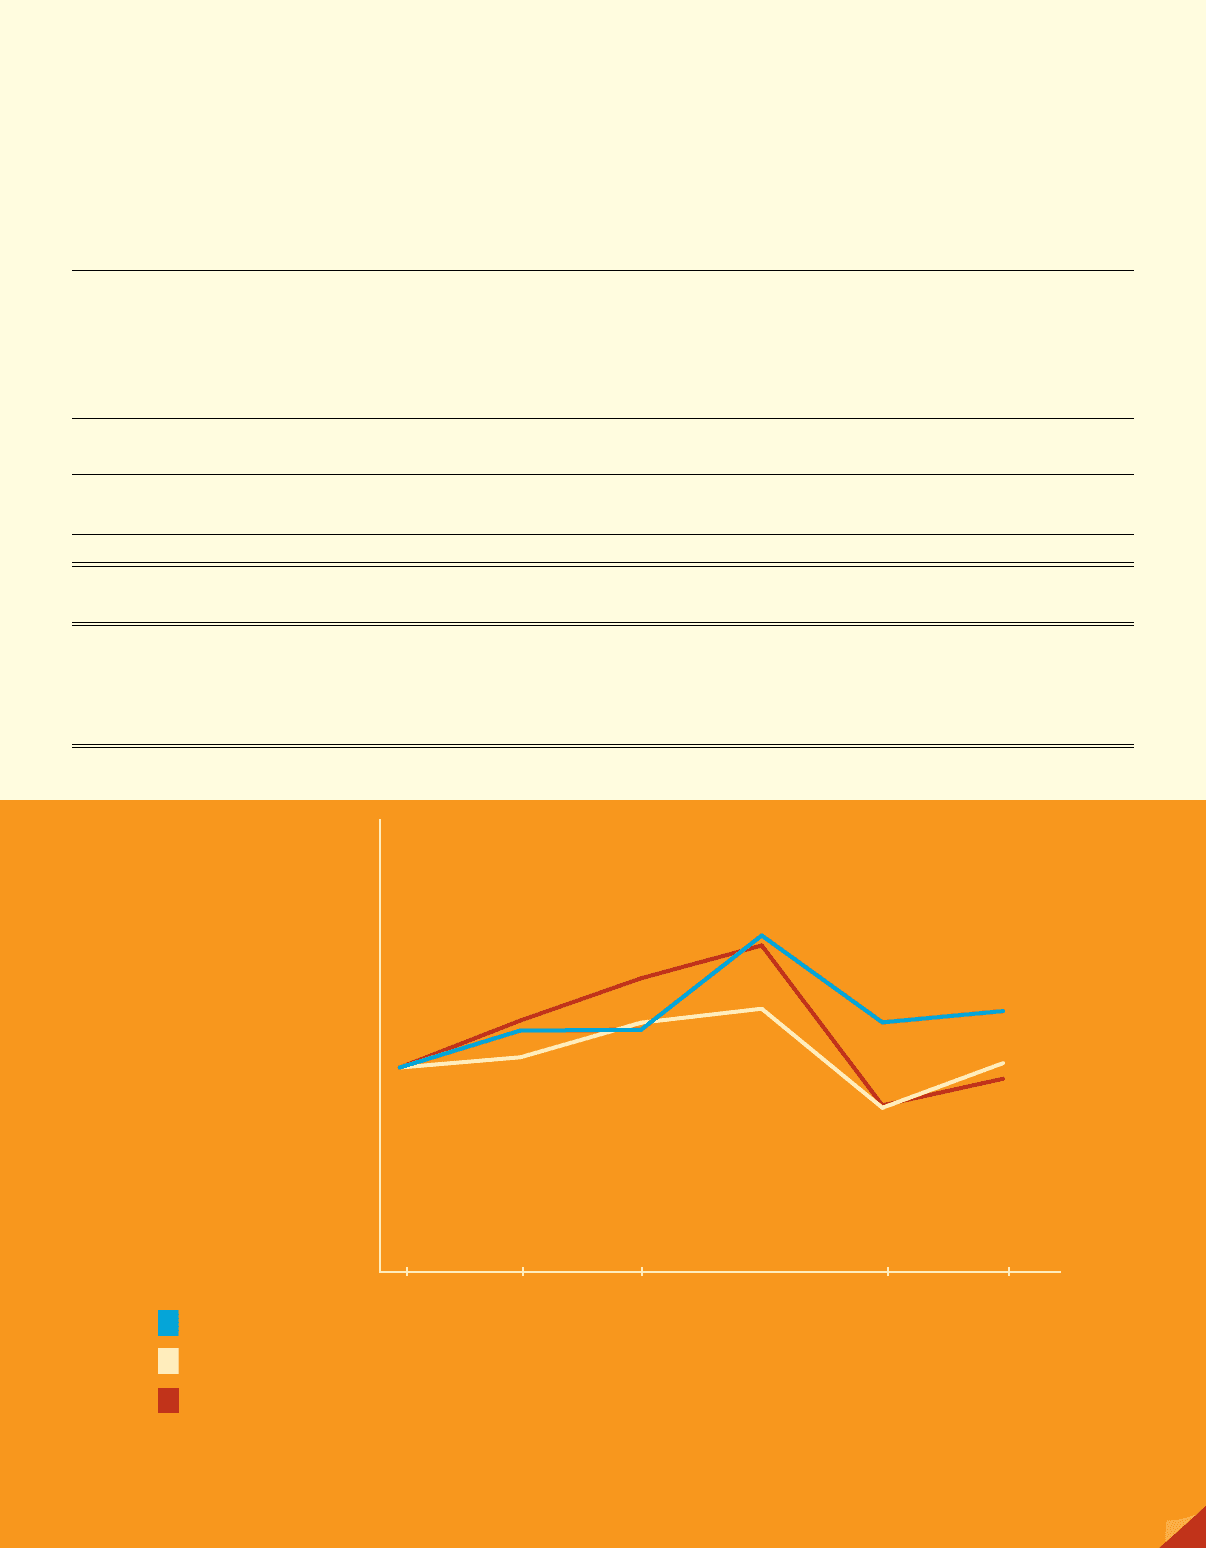
2004 2005 2006 2007 2008 2009
100.00 117.73 118.07 163.23 121.63 127.04
100.00 104.91 121.48 128.16 80.74 102.11
100.00 122.51 142.74 158.45 81.89 94.64
0
50
100
150
$200
S&P 500
Aflac Incorporated
S&P Life & Health Insurance
Comparison
of Five-Year
Cumulative Total
Return*
Among Aflac Incorporated,
the S&P 500 Index and the S&P
Life & Health Insurance Index