Aflac 2009 Annual Report Download - page 48
Download and view the complete annual report
Please find page 48 of the 2009 Aflac annual report below. You can navigate through the pages in the report by either clicking on the pages listed below, or by using the keyword search tool below to find specific information within the annual report.-
 1
1 -
2
-
3
-
4
-
5
-
6
-
7
-
8
-
9
-
10
-
11
-
12
-
13
-
14
-
15
-
16
-
17
-
18
-
19
-
20
-
21
-
22
-
23
-
24
-
25
-
26
-
27
-
28
-
29
-
30
-
31
-
32
-
33
-
34
-
35
-
36
-
37
-
 38
38 -
 39
39 -
 40
40 -
 41
41 -
 42
42 -
 43
43 -
 44
44 -
 45
45 -
 46
46 -
 47
47 -
 48
48 -
 49
49 -
 50
50 -
 51
51 -
 52
52 -
 53
53 -
 54
54 -
 55
55 -
 56
56 -
 57
57 -
 58
58 -
59
-
60
-
61
-
62
-
63
-
64
-
65
-
66
-
67
-
68
-
69
-
70
-
71
-
72
-
73
-
74
-
75
-
76
-
77
-
78
-
79
-
80
-
81
-
82
-
83
-
84
-
85
-
86
-
87
-
88
-
89
-
90
-
91
-
92
-
93
-
94
-
95
-
96
-
97
-
98
 |
 |

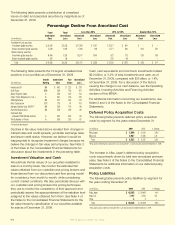
The following table presents a distribution of unrealized
losses on debt and perpetual securities by magnitude as of
December 31, 2009.
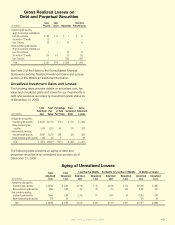
The following table presents the 10 largest unrealized loss
positions in our portfolio as of December 31, 2009.
Declines in fair value noted above resulted from changes in
interest rates and credit spreads, yen/dollar exchange rates,
and issuer credit status. However, we believe it would be
inappropriate to recognize impairment charges because we
believe the changes in fair value are temporary. See Note 3
of the Notes to the Consolidated Financial Statements for
discussion about the investments in the preceding table.
Investment Valuation and Cash
We estimate the fair values of our securities available for
sale on a monthly basis. We monitor the estimated fair
values obtained from our custodian and pricing brokers and
those derived from our discounted cash ow pricing model
for consistency from month to month, while considering
current market conditions. We also periodically discuss with
our custodian and pricing brokers the pricing techniques
they use to monitor the consistency of their approach and
periodically assess the appropriateness of the valuation level
assigned to the values obtained from them. See Note 4 of
the Notes to the Consolidated Financial Statements for the
fair value hierarchy classication of our securities available
for sale as of December 31, 2009.
Cash, cash equivalents and short-term investments totaled
$2.3 billion, or 3.2% of total investments and cash, as of
December 31, 2009, compared with $.9 billion, or 1.4%,
at December 31, 2008. For a discussion of the factors
causing the change in our cash balance, see the Operating
Activities, Investing Activities and Financing Activities
sections of this MD&A.
For additional information concerning our investments, see
Notes 3 and 4 of the Notes to the Consolidated Financial
Statements.
Deferred Policy Acquisition Costs
The following table presents deferred policy acquisition
costs by segment for the years ended December 31.
The increase in Aac Japan’s deferred policy acquisition
costs was primarily driven by total new annualized premium
sales. See Note 5 of the Notes to the Consolidated Financial
Statements for additional information on our deferred policy
acquisition costs.
Policy Liabilities
The following table presents policy liabilities by segment for
the years ending December 31.
Percentage Decline From Amortized Cost
Total Total Less than 20% 20% to 50% Greater than 50%
Amortized Unrealized Amortized Unrealized Amortized Unrealized Amortized Unrealized
(In millions) Cost Loss Cost Loss Cost Loss Cost Loss
Available-for-sale securities:
Investment-grade securities $ 20,160 $ 2,035 $ 17,289 $ 1,191 $ 2,871 $ 844 $ – $ –
Below-investment-grade securities 3,539 1,029 1,366 138 1,571 560 602 331
Held-to-maturity securities:
Investment-grade securities 16,466 1,393 15,517 1,040 623 173 326 180
Below-investment-grade securities 200 98 – – 200 98 – –
Total $ 40,365 $ 4,555 $ 34,172 $ 2,369 $ 5,265 $ 1,675 $ 928 $ 511
Credit Amortized Fair Unrealized
(In millions) Rating Cost Value Loss
Investcorp SA BB $ 452 $ 223 $ 229
SLM Corp. BBB 356 165 191
Banco Espirito Santo A 326 192 134
CSAV (Tollo Shipping Co. S.A.) B 261 135 126
UPM-Kymmene BB 337 224 113
Aiful Corporation CCC 175 74 101
Morgan Stanley Aces 2008-6* BB 200 102 98
Hella KG Hueck & Co. BB 238 148 90
UniCredit SpA
(includes HVB & Bank Austria) A 553 463 90
The Sultanate of Oman A 380 293 87
*Collateralized debt obligation
(In millions)
2009
2008 % Change
Aflac Japan $ 5,846 $ 5,644 3.6%*
Aflac U.S. 2,687 2,593 3.6
Total $ 8,533 $ 8,237 3.6%
*Aflac Japan’s deferred policy acquisition costs increased 4.8% in yen during the year ended December 31, 2009.
(In millions)
2009
2008 % Change
Aflac Japan $ 62,055 $ 59,466 4.4%
Aflac U.S. 7,187 6,750 6.5
Other 3 3 –
Total $ 69,245 $ 66,219 4.6%
*Aflac Japan’s policy liabilities increased 5.6% in yen during the year ended December 31, 2009.
We’ve got you under our wing.
44