Aflac 2009 Annual Report Download - page 26
Download and view the complete annual report
Please find page 26 of the 2009 Aflac annual report below. You can navigate through the pages in the report by either clicking on the pages listed below, or by using the keyword search tool below to find specific information within the annual report.-
 1
1 -
2
-
3
-
4
-
5
-
6
-
7
-
8
-
9
-
10
-
11
-
12
-
13
-
14
-
15
-
 16
16 -
 17
17 -
 18
18 -
 19
19 -
 20
20 -
 21
21 -
 22
22 -
 23
23 -
 24
24 -
 25
25 -
 26
26 -
 27
27 -
 28
28 -
 29
29 -
 30
30 -
 31
31 -
 32
32 -
 33
33 -
 34
34 -
 35
35 -
 36
36 -
37
-
38
-
39
-
40
-
41
-
42
-
43
-
44
-
45
-
46
-
47
-
48
-
49
-
50
-
51
-
52
-
53
-
54
-
55
-
56
-
57
-
58
-
59
-
60
-
61
-
62
-
63
-
64
-
65
-
66
-
67
-
68
-
69
-
70
-
71
-
72
-
73
-
74
-
75
-
76
-
77
-
78
-
79
-
80
-
81
-
82
-
83
-
84
-
85
-
86
-
87
-
88
-
89
-
90
-
91
-
92
-
93
-
94
-
95
-
96
-
97
-
98
 |
 |

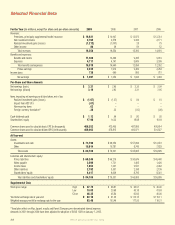
For the Year (In millions, except for share and per-share amounts) 2009 2008 2007 2006
Revenues:
Premiums, principally supplemental health insurance $ 16,621 $ 14,947 $ 12,973 $ 12,314
Net investment income 2,765 2,578 2,333 2,171
Realized investment gains (losses) (1,212) (1,007) 28 79
Other income 80 36 59 52
Total revenues 18,254 16,554 15,393 14,616
Benefits and expenses:
Benefits and claims 11,308 10,499 9,285 9,016
Expenses 4,711 4,141 3,609 3,336
Total benefits and expenses 16,019 14,640 12,894 12,352
Pretax earnings 2,235 1,914 2,499 2,264
Income taxes 738 660 865 781
Net earnings $ 1,497 $ 1,254 $ 1,634 $ 1,483
Per-Share and Share Amounts
Net earnings (basic) $ 3.21 $ 2.65 $ 3.35 $ 2.99
Net earnings (diluted) 3.19 2.62 3.31 2.95
Items impacting net earnings per diluted share, net of tax:
Realized investment gains (losses) $ (1.67) $ (1.37) $ .04 $ .10
Impact from ASC 815 (.01) – – –
Nonrecurring items .02 – – –
Foreign currency translation* .26 .23 (.02) (.08)
Cash dividends paid $ 1.12 $ .96 $ .80 $ .55
Shareholders’ equity 17.96 14.23 18.08 16.93
Common shares used to calculate basic EPS (In thousands) 466,552 473,405 487,869 495,614
Common shares used to calculate diluted EPS (In thousands) 469,063 478,815 493,971 501,827
At Year-end
Assets:
Investments and cash $ 73,192 $ 68,550 $ 57,056 $ 51,972
Other 10,914 10,781 8,749 7,833
Total assets $ 84,106 $ 79,331 $ 65,805 $ 59,805
Liabilities and shareholders’ equity:
Policy liabilities $ 69,245 $ 66,219 $ 50,676 $ 45,440
Notes payable 2,599 1,721 1,465 1,426
Income taxes 1,653 1,201 2,531 2,462
Other liabilities 2,192 3,551 2,338 2,136
Shareholders’ equity 8,417 6,639 8,795 8,341
Total liabilities and shareholders’ equity $ 84,106 $ 79,331 $ 65,805 $ 59,805
Supplemental Data
Stock price range: High $ 47.75 $ 68.81 $ 63.91 $ 49.40
Low 10.83 29.68 45.18 41.63
Close 46.25 45.84 62.63 46.00
Yen/dollar exchange rate at year-end ¥ 92.10 ¥ 91.03 ¥ 114.15 ¥ 119.11
Weighted-average yen/dollar exchange rate for the year 93.49 103.46 117.93 116.31
*Translation effect on Aflac Japan’s results and Parent Company yen-denominated interest expense
Amounts in 2001 through 2004 have been adjusted for adoption of SFAS 123R on January 1, 2005.
Selected Financial Data
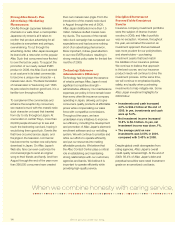
We’ve got you under our wing.
22