Aflac 2009 Annual Report Download - page 81
Download and view the complete annual report
Please find page 81 of the 2009 Aflac annual report below. You can navigate through the pages in the report by either clicking on the pages listed below, or by using the keyword search tool below to find specific information within the annual report.-
 1
1 -
2
-
3
-
4
-
5
-
6
-
7
-
8
-
9
-
10
-
11
-
12
-
13
-
14
-
15
-
16
-
17
-
18
-
19
-
20
-
21
-
22
-
23
-
24
-
25
-
26
-
27
-
28
-
29
-
30
-
31
-
32
-
33
-
34
-
35
-
36
-
37
-
38
-
39
-
40
-
41
-
42
-
43
-
44
-
45
-
46
-
47
-
48
-
49
-
50
-
51
-
52
-
53
-
54
-
55
-
56
-
57
-
58
-
59
-
60
-
61
-
62
-
63
-
64
-
65
-
66
-
67
-
68
-
69
-
70
-
 71
71 -
 72
72 -
 73
73 -
 74
74 -
 75
75 -
 76
76 -
 77
77 -
 78
78 -
 79
79 -
 80
80 -
 81
81 -
 82
82 -
 83
83 -
 84
84 -
 85
85 -
 86
86 -
 87
87 -
 88
88 -
 89
89 -
 90
90 -
 91
91 -
92
-
93
-
94
-
95
-
96
-
97
-
98
 |
 |

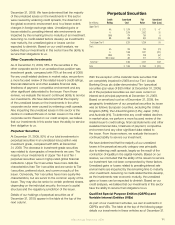
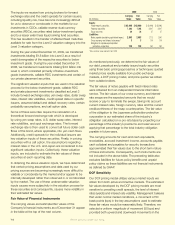
assumptions. Since the changes in fair value are relatively
linear, readers of these nancial statements can make their
own judgments as to the movement in interest rates and
the change in fair value based upon this data. The following
scenarios provide a view of the sensitivity of our securities
priced by our DCF pricing model.
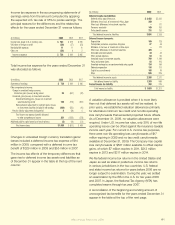
The fair values of our available-for-sale xed-maturity and
perpetual securities valued by our DCF pricing model totaled
$14.8 billion at December 31, 2009. The estimated effect
of potential changes in interest rates, credit spreads and
interest rate volatility on these fair values as of such date is
as follows:
Interest Rates Credit Spreads Interest Rate Volatility
Factor Change in fair Factor Change in fair Factor Change in fair
change value (in millions) change value (in millions) change value (in millions)
+50 bps $ (746) +50 bps $ (755) +50 bps $ (24)
-50 bps 801 -50 bps 813 -50 bps 18
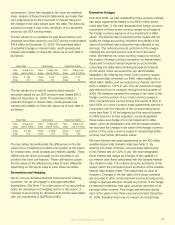
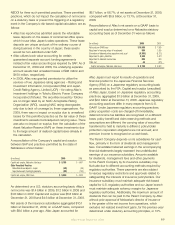
The fair values of our held-to-maturity xed-maturity
securities valued by our DCF pricing model totaled $24.2
billion at December 31, 2009. The estimated effect of
potential changes in interest rates, credit spreads and
interest rate volatility on these fair values as of such date is
as follows:
Interest Rates Credit Spreads Interest Rate Volatility
Factor Change in fair Factor Change in fair Factor Change in fair
change value (in millions) change value (in millions) change value (in millions)
+50 bps $ (1,475) +50 bps $ (1,609) +50 bps $ (410)
-50 bps 1,520 -50 bps 1,702 -50 bps 396
The two tables above illustrate the differences on the fair
values of our investment portfolio among each of the inputs
for interest rates, credit spreads and interest volatility. These
differences are driven principally by the securities in our
portfolio that have call features. These call features cause
the fair values of the affected securities to react differently
depending on the inputs used to price these securities.
Derivatives and Hedging
We do not use derivative nancial instruments for trading
purposes, nor do we engage in leveraged derivative
transactions. See Note 1 for a discussion of our accounting
policy for derivatives and hedging and for a discussion of
changes in accounting for derivative instruments associated
with our investments in QSPEs and VIEs.
Derivative Hedges
Until April 2009, we had outstanding cross-currency interest
rate swap agreements related to our $450 million senior
notes (see Note 7). We had designated the foreign currency
component of these cross-currency swaps as a hedge of
the foreign currency exposure of our investment in Aac
Japan. The interest rate component of the swaps did not
qualify for hedge accounting, therefore the change in fair
value of the interest rate component was reected in net
earnings. The notional amounts and terms of the swaps
matched the principal amount and terms of the senior
notes. We entered into cross-currency swaps to minimize
the impact of foreign currency translation on shareholders’
equity and to reduce interest expense by economically
converting the dollar-denominated principal and interest
on the senior notes we issued into yen-denominated
obligations. By entering into these cross-currency swaps,
we economically converted our $450 million liability into a
¥55.6 billion liability, and we reduced our interest rate from
6.5% in dollars to 1.67% in yen. The net investment hedge
was effective from its inception through the rst quarter of
2009. We therefore reported the change in fair value of the
foreign currency portion of our cross-currency swaps in
other comprehensive income during that period of time. In
April 2009, our cross-currency swap agreements expired in
conjunction with the maturity of the corresponding senior
notes (see Note 7). At the beginning of the second quarter
of 2009 and prior to their expiration, we de-designated
these swaps as a hedge of our net investment in Aac
Japan. Upon de-designation and until the swaps expired,
we recorded the change in fair value of the foreign currency
portion of the cross-currency swaps in net earnings (other
income). See further discussion below.
We have interest rate swap agreements on the ¥20 billion
variable interest rate Uridashi notes (see Note 7). By
entering into these contracts, we have been able to lock
in the interest rate at 1.52% in yen. We have designated
these interest rate swaps as a hedge of the variability in
our interest cash ows associated with the variable interest
rate Uridashi notes. The notional amounts and terms of the
swaps match the principal amount and terms of the variable
interest rate Uridashi notes. The swaps had no value at
inception. Changes in the fair value of the swap contracts
are recorded in other comprehensive income as long as the
hedge is deemed effective. Should any portion of the hedge
be deemed ineffective, that value would be reported in net
earnings (other income). This hedge was effective during
each of the years in the three-year period ended December
31, 2009, therefore there was no impact on net earnings.
Aflac Annual Report for 2009 77