Aflac 2009 Annual Report Download - page 21
Download and view the complete annual report
Please find page 21 of the 2009 Aflac annual report below. You can navigate through the pages in the report by either clicking on the pages listed below, or by using the keyword search tool below to find specific information within the annual report.-
 1
1 -
2
-
3
-
4
-
5
-
6
-
7
-
8
-
9
-
10
-
 11
11 -
 12
12 -
 13
13 -
 14
14 -
 15
15 -
 16
16 -
 17
17 -
 18
18 -
 19
19 -
 20
20 -
 21
21 -
 22
22 -
 23
23 -
 24
24 -
 25
25 -
 26
26 -
 27
27 -
 28
28 -
 29
29 -
 30
30 -
 31
31 -
32
-
33
-
34
-
35
-
36
-
37
-
38
-
39
-
40
-
41
-
42
-
43
-
44
-
45
-
46
-
47
-
48
-
49
-
50
-
51
-
52
-
53
-
54
-
55
-
56
-
57
-
58
-
59
-
60
-
61
-
62
-
63
-
64
-
65
-
66
-
67
-
68
-
69
-
70
-
71
-
72
-
73
-
74
-
75
-
76
-
77
-
78
-
79
-
80
-
81
-
82
-
83
-
84
-
85
-
86
-
87
-
88
-
89
-
90
-
91
-
92
-
93
-
94
-
95
-
96
-
97
-
98
 |
 |

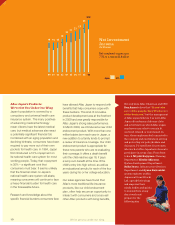
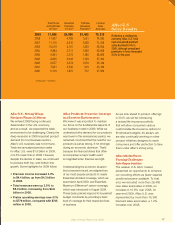
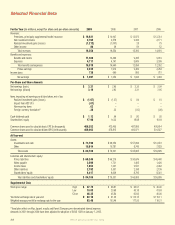
Total Policies Annualized Total New Licensed
and Certificates Premiums Annualized Sales
In Force* In Force** Premiums** Associates
2009 11,688 $4,956 $1,453 75,315
2008 11,437 4,789 1,551 74,390
2007 11,116 4,510 1,558 71,258
2006 10,519 4,101 1,423 68,394
2005 9,884 3,711 1,259 63,008
2004 9,341 3,374 1,186 58,992
2003 8,805 3,043 1,128 57,493
2002 8,077 2,674 1,070 53,149
2001 7,031 2,238 919 43,188
2000 6,119 1,861 712 37,509
*In thousands **In millions
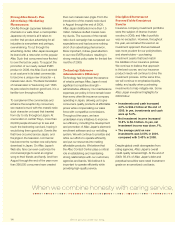
Aflac U.S.
Sales Results
Reflecting a challenging
economy, Aflac U.S. total
new annualized premium
sales declined 6.4% in
2009, although annualized
premiums in force increased
3.5% for the year.
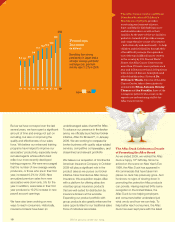
Aflac U.S.: Strong Wings
Navigate Financial Storm
We entered 2009 facing continued
deterioration in the U.S. economy,
and as a result, we expected the sales
environment to be challenging. Clearly, the
deep recession in 2009 impacted product
demand for most business sectors.
Aac’s U.S. business was not immune.
Total new annualized premium sales
for Aac U.S. were $1.5 billion in 2009,
or 6.4% lower than in 2008. However,
despite the decline in sales, we continued
to produce both top- and bottom-line
growth. Some highlights for 2009 follow:
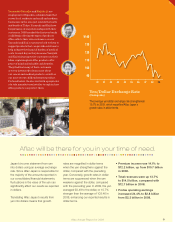
• Premium income increased 4.0%
to $4.4 billion, up from $4.3 billion
in 2008.
• Total revenues were up 3.5% to
$5.0 billion, increasing from $4.8
billion in 2008.
• Pretax operating earnings rose 4.1%
to $776 million, compared with $745
million in 2008.
Aflac Products: Proactive Coverage
in a Reactive Environment
We knew it was important to maintain
our focus on the fundamental aspects of
our business model in 2009. While we
understood why demand for our products
was lower in this recessionary period, we
remained convinced that the need for our
products is just as strong, if not stronger,
during an economic downturn. That’s
because the nancial stress that often
accompanies a major health event
is magnied when nances are tight.
Understanding the economic situation
that consumers faced, we adapted two
of our most popular products to create
Essentials Accident coverage, which we
launched in April 2009, and Essentials
Maximum Difference
®
cancer coverage,
which was introduced in August 2009.
These basic policies respond to household
budget constraints by providing a basic
level of coverage for their respective lines
of business.
As we look ahead to product offerings
in 2010, we will be introducing
a revised life insurance portfolio
that will allow consumers various
customizable life insurance options to
t individual budgets. As always, we
are also continually working on other
product initiatives designed to reach
consumers and offer protection to take
them under Aac’s strong wing.
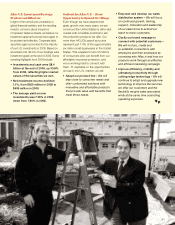
Aflac’s Sales Force:
Turning Challenges
Into Opportunities
The weaker U.S. labor market
presented an opportunity to enhance
our recruiting efforts as fewer salaried
positions became available. To that
end, we recruited more than 28,400
new sales associates in 2009, an
increase of 10.6% over 2008. At
year-end 2009, Aac U.S. was
represented by more than 75,300
licensed sales associates, a 1.2%
increase over 2008.
Aflac Annual Report for 2009 17