Aflac 2009 Annual Report Download - page 80
Download and view the complete annual report
Please find page 80 of the 2009 Aflac annual report below. You can navigate through the pages in the report by either clicking on the pages listed below, or by using the keyword search tool below to find specific information within the annual report.-
 1
1 -
2
-
3
-
4
-
5
-
6
-
7
-
8
-
9
-
10
-
11
-
12
-
13
-
14
-
15
-
16
-
17
-
18
-
19
-
20
-
21
-
22
-
23
-
24
-
25
-
26
-
27
-
28
-
29
-
30
-
31
-
32
-
33
-
34
-
35
-
36
-
37
-
38
-
39
-
40
-
41
-
42
-
43
-
44
-
45
-
46
-
47
-
48
-
49
-
50
-
51
-
52
-
53
-
54
-
55
-
56
-
57
-
58
-
59
-
60
-
61
-
62
-
63
-
64
-
65
-
66
-
67
-
68
-
69
-
 70
70 -
 71
71 -
 72
72 -
 73
73 -
 74
74 -
 75
75 -
 76
76 -
 77
77 -
 78
78 -
 79
79 -
 80
80 -
 81
81 -
 82
82 -
 83
83 -
 84
84 -
 85
85 -
 86
86 -
 87
87 -
 88
88 -
 89
89 -
 90
90 -
91
-
92
-
93
-
94
-
95
-
96
-
97
-
98
 |
 |

The inputs we receive from pricing brokers for forward
exchange rates and the credit spreads for certain issuers,
including liquidity risk, have become increasingly difcult
for us to observe or corroborate in the markets for our
investments in CDOs, callable reverse-dual currency
securities (RDCs), securities rated below investment grade,
and to a lesser extent less liquid sinking fund securities.
This has resulted in the transfer of affected xed maturities
available for sale from the Level 2 valuation category into the
Level 3 valuation category.
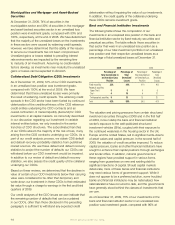
During the year ended December 31, 2009, we transferred
investments totaling $1.8 billion into Level 3 as a result of
credit downgrades of the respective securities to below
investment grade. During the year ended December 31,
2008, we transferred investments totaling $3.0 billion into
Level 3, which consisted primarily of below-investment-
grade investments, callable RDC investments and certain of
our private placement securities.
The signicant valuation inputs that are used in the valuation
process for the below-investment-grade, callable RDC
and private placement investments classied as Level 3
include forward exchange rates, yen swap rates, dollar swap
rates, interest rate volatilities, credit spread data on specic
issuers, assumed default and default recovery rates, certain
probability assumptions, and call option data.
Some of these securities require the calculation of a
theoretical forward exchange rate which is developed
by using yen swap rates, U.S. dollar swap rates, interest
rate volatilities, and spot exchange rates. The forward
exchange rate is then used to convert all future dollar cash
ows of the bond, where applicable, into yen cash ows.
Additionally, credit spreads for the individual issuers are
key valuation inputs of these securities. Finally, in pricing
securities with a call option, the assumptions regarding
interest rates in the U.S. and Japan are considered to be
signicant valuation inputs. Collectively, these valuation
inputs, are included to estimate the fair values of these
securities at each reporting date.
In obtaining the above valuation inputs, we have determined
that certain pricing assumptions and data used by our
pricing sources are becoming increasingly more difcult to
validate or corroborate by the market and/or appear to be
internally developed rather than observed in or corroborated
by the market. The use of these unobservable valuation
inputs causes more subjectivity in the valuation process for
these securities and consequently, causes more volatility in
their estimated fair values.
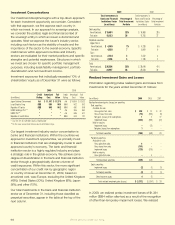
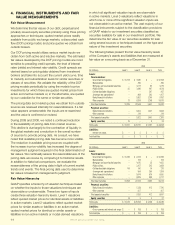
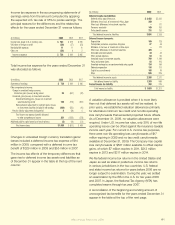
Fair Value of Financial Instruments
The carrying values and estimated fair values of the
Company’s nancial instruments as of December 31 appear
in the table at the top of the next column.
2009 2008
Carrying Fair Carrying Fair
(In millions) Value Value Value Value
Assets:
Fixed-maturity securities $ 63,468 $ 62,609 $ 59,448 $ 58,096
Perpetual securities 7,263 7,263 8,047 8,047
Equity securities 24 24 27 27
Liabilities:
Notes payable (excluding capitalized leases) 2,593 2,683 1,713 1,561
Cross-currency and interest rate swaps* 3 3 158 158
Obligation to Japanese policyholder
protection corporation 128 128 161 161
*Cross-currency swaps expired in April 2009
As mentioned previously, we determine the fair values of
our debt, perpetual and privately issued equity securities
using three basic pricing approaches or techniques: quoted
market prices readily available from public exchange
markets, a DCF pricing model, and price quotes we obtain
from outside brokers.
The fair values of notes payable with xed interest rates
were obtained from an independent nancial information
service. The fair values of our cross-currency and interest-
rate swaps are the expected amounts that we would
receive or pay to terminate the swaps, taking into account
current interest rates, foreign currency rates and the current
creditworthiness of the swap counterparties. The fair value
of the obligation to the Japanese policyholder protection
corporation is our estimated share of the industry’s
obligation calculated on a pro rata basis by projecting our
percentage of the industry’s premiums and reserves and
applying that percentage to the total industry obligation
payable in future years.
The carrying amounts for cash and cash equivalents,
receivables, accrued investment income, accounts payable,
cash collateral and payables for security transactions
approximated their fair values due to the short-term nature
of these instruments. Consequently, such instruments are
not included in the above table. The preceding table also
excludes liabilities for future policy benets and unpaid
policy claims as these liabilities are not nancial instruments
as dened by GAAP.
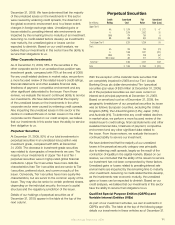
DCF Sensitivity
Our DCF pricing model utilizes various market inputs we
obtain from both active and inactive markets. The estimated
fair values developed by the DCF pricing models are most
sensitive to prevailing credit spreads, the level of interest
rates (yields) and interest rate volatility. Management believes
that under normal market conditions, a movement of 50
basis points (bps) in the key assumptions used to estimate
these fair values would be reasonably likely. Therefore, we
selected a uniform magnitude of movement (50 bps) and
provided both upward and downward movements in the
We’ve got you under our wing.
76