Aflac 2009 Annual Report Download - page 83
Download and view the complete annual report
Please find page 83 of the 2009 Aflac annual report below. You can navigate through the pages in the report by either clicking on the pages listed below, or by using the keyword search tool below to find specific information within the annual report.-
 1
1 -
2
-
3
-
4
-
5
-
6
-
7
-
8
-
9
-
10
-
11
-
12
-
13
-
14
-
15
-
16
-
17
-
18
-
19
-
20
-
21
-
22
-
23
-
24
-
25
-
26
-
27
-
28
-
29
-
30
-
31
-
32
-
33
-
34
-
35
-
36
-
37
-
38
-
39
-
40
-
41
-
42
-
43
-
44
-
45
-
46
-
47
-
48
-
49
-
50
-
51
-
52
-
53
-
54
-
55
-
56
-
57
-
58
-
59
-
60
-
61
-
62
-
63
-
64
-
65
-
66
-
67
-
68
-
69
-
70
-
71
-
72
-
 73
73 -
 74
74 -
 75
75 -
 76
76 -
 77
77 -
 78
78 -
 79
79 -
 80
80 -
 81
81 -
 82
82 -
 83
83 -
 84
84 -
 85
85 -
 86
86 -
 87
87 -
 88
88 -
 89
89 -
 90
90 -
 91
91 -
 92
92 -
 93
93 -
94
-
95
-
96
-
97
-
98
 |
 |

(In millions) 2009 2008 2007
Depreciation expense $ 60 $ 57 $ 51
Other amortization expense 21 17 14
Total depreciation and other amortization expense* $ 81 $ 74 $ 65
*Aflac Japan accounted for $46 in 2009, $43 in 2008 and $37 in 2007.
Lease and rental expense, which are included in insurance
expenses in the consolidated statements of earnings, were
as follows for the years ended December 31:
(In millions) 2009 2008 2007
Lease and rental expense:
Aflac Japan $ 72 $ 68 $ 51
Aflac U.S. 8 9 8
Other 1 1 –
Total lease and rental expense $ 81 $ 78 $ 59
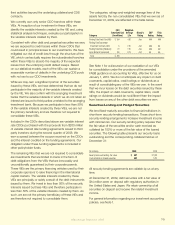
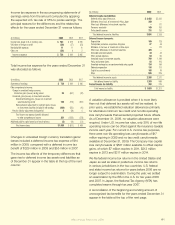
6. POLICY LIABILITIES
Policy liabilities primarily include future policy benets and
unpaid policy claims, which accounted for 89% and 5% of
total policy liabilities at December 31, 2009, respectively. We
regularly review the adequacy of our policy liabilities in total
and by component. The liability for future policy benets as
of December 31 consisted of the following:
Liability Amounts Interest Rates
Policy Issue Year of In 20
(In millions) Year 2009 2008 Issue Years
Health insurance:
Japan: 2005 - 2009 $ 798 $ 527 1.5 - 2.75% 1.5 - 2.75%
1999 - 2009 10,815 9,558 3.0 3.0
1997 - 1999 3,438 3,415 3.5 3.5
1995 - 1996 372 367 4.0 4.0
1994 - 1996 4,927 4,908 4.5 4.5
1987 - 1994 21,563 21,734 5.25 - 5.5 5.25 - 5.5
1978 - 1986 5,084 5,233 6.5 - 6.75 5.5
1974 - 1979 939 1,015 7.0 5.0
U.S.: 2005 - 2009 1,935 1,562 5.5 5.5
1998 - 2004 1,122 1,048 7.0 7.0
1988 - 2004 940 1,016 8.0 6.0
1986 - 2004 1,349 1,405 6.0 6.0
1985 - 1986 24 25 6.5 6.5
1981 - 1986 196 203 7.0 5.5
Other 28 30
Life insurance:
Japan: 2007 - 2009 402 197 2.75 2.75
2006 - 2009 462 301 2.5 2.5
2001 - 2009 904 746 1.65 - 1.85 1.65 - 1.85
1999 - 2009 1,660 1,592 3.0 3.0
1997 - 2009 782 779 3.5 3.5
1994 - 1996 1,173 1,177 4.0 4.0
1985 - 1993 2,401 2,316 5.25 - 5.65 5.25 - 5.65
U.S.: 1956 - 2009 187 156 4.0 - 6.0 4.0 - 6.0
Total $ 61,501 $ 59,310
The weighted-average interest rates reected in the
consolidated statements of earnings for future policy
benets for Japanese policies were 4.5% in 2009 and 4.6%
in both 2008 and 2007; and for U.S. policies, 6.1% in both
2009 and 2008 and 6.2% in 2007.
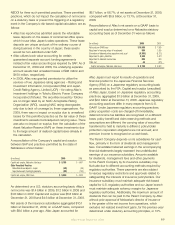
Changes in the liability for unpaid policy claims were as
follows for the years ended December 31:
(In millions) 2009 2008 2007
Unpaid supplemental health claims, beginning of year $ 2,959 $ 2,332 $ 2,293
Add claims incurred during the year related to:
Current year 6,864 6,127 5,225
Prior years (398) (253) (401)
Total incurred 6,466 5,874 4,824
Less claims paid during the year on claims incurred during:
Current year 4,683 4,177 3,600
Prior years 1,618 1,476 1,257
Total paid 6,301 5,653 4,857
Effect of foreign exchange rate changes on unpaid claims (19) 406 72
Unpaid supplemental health claims, end of year 3,105 2,959 2,332
Unpaid life claims, end of year 165 159 123
Total liability for unpaid policy claims $ 3,270 $ 3,118 $ 2,455
The incurred claims development related to prior years
reects favorable development in the unpaid policy claims
liability previously provided for. There are no additional
or return of premium considerations associated with that
development.
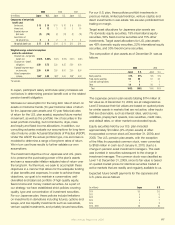
7. NOTES PAYABLE
A summary of notes payable as of December 31 follows:
(In millions) 2009 2008
8.50% senior notes due May 2019 $ 850 $ –
6.90% senior notes due December 2039 396* –
6.50% senior notes paid April 2009 – 450
Yen-denominated Uridashi notes:
1.52% notes due September 2011 (principal amount ¥15 billion) 163 165
2.26% notes due September 2016 (principal amount ¥8 billion in 2009
and ¥10 billion in 2008) 87 110
Variable interest rate notes due September 2011 (.78% at
December 2009, principal amount ¥20 billion) 217 220
Yen-denominated Samurai notes:
.71% notes due July 2010 (principal amount ¥39.4 billion in 2009
and ¥40 billion in 2008) 428 439
1.87% notes due June 2012 (principal amount ¥26.6 billion in 2009
and ¥30 billion in 2008) 289 329
Yen-denominated loans:
3.60% loan due July 2015 (principal amount ¥10 billion) 109 –
3.00% loan due August 2015 (principal amount ¥5 billion) 54 –
Capitalized lease obligations payable through 2015 6 8
Total notes payable $ 2,599 $ 1,721
*$400 issuance net of a $4 underwriting discount that is being amortized over the life of the notes
Aflac Annual Report for 2009 79