Aflac 2009 Annual Report Download - page 78
Download and view the complete annual report
Please find page 78 of the 2009 Aflac annual report below. You can navigate through the pages in the report by either clicking on the pages listed below, or by using the keyword search tool below to find specific information within the annual report.-
 1
1 -
2
-
3
-
4
-
5
-
6
-
7
-
8
-
9
-
10
-
11
-
12
-
13
-
14
-
15
-
16
-
17
-
18
-
19
-
20
-
21
-
22
-
23
-
24
-
25
-
26
-
27
-
28
-
29
-
30
-
31
-
32
-
33
-
34
-
35
-
36
-
37
-
38
-
39
-
40
-
41
-
42
-
43
-
44
-
45
-
46
-
47
-
48
-
49
-
50
-
51
-
52
-
53
-
54
-
55
-
56
-
57
-
58
-
59
-
60
-
61
-
62
-
63
-
64
-
65
-
66
-
67
-
 68
68 -
 69
69 -
 70
70 -
 71
71 -
 72
72 -
 73
73 -
 74
74 -
 75
75 -
 76
76 -
 77
77 -
 78
78 -
 79
79 -
 80
80 -
 81
81 -
 82
82 -
 83
83 -
 84
84 -
 85
85 -
 86
86 -
 87
87 -
 88
88 -
89
-
90
-
91
-
92
-
93
-
94
-
95
-
96
-
97
-
98
 |
 |

4. FINANCIAL INSTRUMENTS AND FAIR
VALUE MEASUREMENTS
Fair Value Measurement
We determine the fair values of our debt, perpetual and
privately issued equity securities primarily using three pricing
approaches or techniques: quoted market prices readily
available from public exchange markets, a discounted cash
ow (DCF) pricing model, and price quotes we obtain from
outside brokers.
Our DCF pricing model utilizes various market inputs we
obtain from both active and inactive markets. The estimated
fair values developed by the DCF pricing models are most
sensitive to prevailing credit spreads, the level of interest
rates (yields) and interest rate volatility. Credit spreads are
derived based on pricing data obtained from investment
brokers and take into account the current yield curve, time
to maturity and subordination levels for similar securities or
classes of securities. We validate the reliability of the DCF
pricing models periodically by using the models to price
investments for which there are quoted market prices from
active and inactive markets or, in the alternative, are quoted
by our custodian for the same or similar securities.
The pricing data and market quotes we obtain from outside
sources are reviewed internally for reasonableness. If a fair
value appears unreasonable, the inputs are re-examined
and the value is conrmed or revised.
During 2009 and 2008, we noted a continued reduction
in the availability of pricing data from market sources.
This decline is due largely to the contraction of liquidity in
the global markets and a reduction in the overall number
of sources to provide pricing data. As a result, we have
noted that available pricing data has become more volatile.
The reduction in available pricing sources coupled with
the increase in price volatility has increased the degree of
management judgment required in the nal determination of
fair values. We continually assess the reasonableness of the
pricing data we receive by comparing it to historical results.
In addition to historical comparisons, we evaluate the
reasonableness of the pricing data in light of current market
trends and events. The nal pricing data used to determine
fair values is based on management’s judgment.
Fair Value Hierarchy
GAAP species a hierarchy of valuation techniques based
on whether the inputs to those valuations techniques are
observable or unobservable. These two types of inputs
create three valuation hierarchy levels. Level 1 valuations
reect quoted market prices for identical assets or liabilities
in active markets. Level 2 valuations reect quoted market
prices for similar assets or liabilities in an active market,
quoted market prices for identical or similar assets or
liabilities in non-active markets or model-derived valuations
in which all signicant valuation inputs are observable
in active markets. Level 3 valuations reect valuations in
which one or more of the signicant valuation inputs are
not observable in an active market. The vast majority of our
nancial instruments subject to the classication provisions
of GAAP relate to our investment securities classied as
securities available for sale in our investment portfolio. We
determine the fair value of our securities available for sale
using several sources or techniques based on the type and
nature of the investment securities.
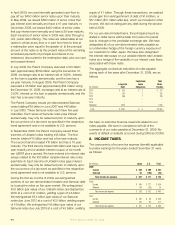
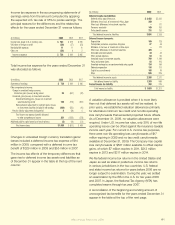
The following tables present the fair value hierarchy levels
of the Company’s assets and liabilities that are measured at
fair value on a recurring basis as of December 31.
2009
(In millions) Level 1 Level 2 Level 3 Total
Assets:
Fixed maturities:
Government and agencies $ 10,178 $ 1,980 $ – $ 12,158
Municipalities – 495 – 495
Mortgage- and asset-backed securities – 1,017 62 1,079
Public utilities 35 3,486 497 4,018
Collateralized debt obligations – – 267 267
Sovereign and supranational – 864 293 1,157
Banks/financial institutions – 5,852 1,240 7,092
Other corporate 13 9,254 1,248 10,515
Total fixed maturities 10,226 22,948 3,607 36,781
Perpetual securities:
Banks/financial institutions – 5,503 1,441 6,944
Other corporate – 319 – 319
Total perpetual securities – 5,822 1,441 7,263
Equity securities 15 – 9 24
Total assets $ 10,241 $ 28,770 $ 5,057 $ 44,068
Liabilities:
Interest rate swaps $ – $ 3 $ – $ 3
Total liabilities $ – $ 3 $ – $ 3
2008
(In millions) Level 1 Level 2 Level 3 Total
Assets:
Fixed maturities:
Government and agencies $ 10,182 $ 2,214 $ – $ 12,396
Municipalities – 106 – 106
Mortgage- and asset-backed securities – 1,020 35 1,055
Public utilities – 3,157 502 3,659
Collateralized debt obligations 116 140 19 275
Sovereign and supranational – 994 260 1,254
Banks/financial institutions – 5,674 876 6,550
Other corporate – 8,819 898 9,717
Total fixed maturities 10,298 22,124 2,590 35,012
Perpetual securities:
Banks/financial institutions – 7,328 412 7,740
Other corporate – 307 – 307
Total perpetual securities – 7,635 412 8,047
Equity securities 18 5 4 27
Total assets $ 10,316 $ 29,764 $ 3,006 $ 43,086
Liabilities:
Cross-currency and interest rate swaps $ – $ 158 $ – $ 158
Total liabilities $ – $ 158 $ – $ 158
We’ve got you under our wing.
74