Aflac 2009 Annual Report Download - page 51
Download and view the complete annual report
Please find page 51 of the 2009 Aflac annual report below. You can navigate through the pages in the report by either clicking on the pages listed below, or by using the keyword search tool below to find specific information within the annual report.-
 1
1 -
2
-
3
-
4
-
5
-
6
-
7
-
8
-
9
-
10
-
11
-
12
-
13
-
14
-
15
-
16
-
17
-
18
-
19
-
20
-
21
-
22
-
23
-
24
-
25
-
26
-
27
-
28
-
29
-
30
-
31
-
32
-
33
-
34
-
35
-
36
-
37
-
38
-
39
-
40
-
 41
41 -
 42
42 -
 43
43 -
 44
44 -
 45
45 -
 46
46 -
 47
47 -
 48
48 -
 49
49 -
 50
50 -
 51
51 -
 52
52 -
 53
53 -
 54
54 -
 55
55 -
 56
56 -
 57
57 -
 58
58 -
 59
59 -
 60
60 -
 61
61 -
62
-
63
-
64
-
65
-
66
-
67
-
68
-
69
-
70
-
71
-
72
-
73
-
74
-
75
-
76
-
77
-
78
-
79
-
80
-
81
-
82
-
83
-
84
-
85
-
86
-
87
-
88
-
89
-
90
-
91
-
92
-
93
-
94
-
95
-
96
-
97
-
98
 |
 |

notes ($428 million at the December 31, 2009, exchange
rate) that are due in July 2010. We plan to use existing cash
to redeem these notes. See Note 7 of the Notes to the
Consolidated Financial Statements for more information.
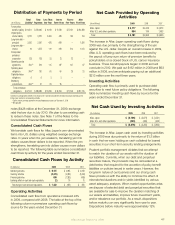
Consolidated Cash Flows
We translate cash ows for Aac Japan’s yen-denominated
items into U.S. dollars using weighted-average exchange
rates. In years when the yen weakens, translating yen into
dollars causes fewer dollars to be reported. When the yen
strengthens, translating yen into dollars causes more dollars
to be reported. The following table summarizes consolidated
cash ows by activity for the years ended December 31.
Operating Activities
Consolidated cash ow from operations increased 24%
in 2009, compared with 2008. The table at the top of the
following column summarizes operating cash ows by
source for the years ended December 31.
The increase in Aac Japan operating cash ows during
2009 was due primarily to the strengthening of the yen
against the U.S. dollar. Despite an overall increase in 2009,
Aac U.S. operating cash ows have been reduced by
the payout of lump-sum return-of-premium benets to
policyholders on a closed block of U.S. cancer insurance
business. These benet payouts began in 2008 and will
conclude in 2012. We paid out $152 million in 2009 and $63
million in 2008, and we anticipate paying out an additional
$213 million over the next three years.
Investing Activities
Operating cash ow is primarily used to purchase debt
securities to meet future policy obligations. The following
table summarizes investing cash ows by source for the
years ended December 31.
The increase in Aac Japan cash used by investing activities
during 2009 was due primarily to the return of $1.2 billion
in cash that we were holding as cash collateral for loaned
securities in our short-term security lending arrangements.
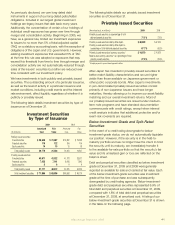
Prudent portfolio management dictates that we attempt
to match the duration of our assets with the duration of
our liabilities. Currently, when our debt and perpetual
securities mature, the proceeds may be reinvested at a
yield below that required for the accretion of policy benet
liabilities on policies issued in earlier years. However, the
long-term nature of our business and our strong cash
ows provide us with the ability to minimize the effect of
mismatched durations and/or yields identied by various
asset adequacy analyses. When market opportunities arise,
we dispose of selected debt and perpetual securities that
are available for sale to improve the duration matching of
our assets and liabilities, improve future investment yields,
and/or rebalance our portfolio. As a result, dispositions
before maturity can vary signicantly from year to year.
Dispositions before maturity were approximately 12%
Distribution of Payments by Period
Total Total Less Than One to Four to After
(In millions) *Liability* Payments One Year Three Years Five Years Five Years
Future policy
benefits liability $ 61,501 $ 278,065 $ 9,018 $ 17,528 $ 17,151 $ 234,368
Unpaid policy
claims liability 3,270 3,270 2,463 483 190 134
Long-term debt –
principal 2,593 2,597 428 669 – 1,500
Long-term debt –
interest 16 1,572 119 226 214 1,013
Policyholder
protection
corporation 128 128 33 73 22 –
Operating service
agreements N/A** 516 115 187 147 67
Operating lease
obligations N/A** 181 63 60 25 33
Capitalized lease
obligations 6 6 3 3 – –
Marketing
commitments N/A** 51 26 25 – –
Total contractual
obligations $ 67,514 $ 286,386 $ 12,268 $ 19,254 $ 17,749 $ 237,115
Liabilities for unrecognized tax benefits in the amount of $11 have been excluded from the tabular disclosure above because the
timing of cash payment is not reasonably estimable.
* Liability amounts are those reported on the consolidated balance sheet as of December 31, 2009.
** Not applicable
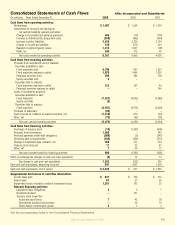
Consolidated Cash Flows by Activity
(In millions) 2009 2008
2007
Operating activities $ 6,161 $ 4,965 $ 4,656
Investing activities (5,476) (4,283) (3,654)
Financing activities 699 (1,383) (655)
Exchange effect on cash and cash equivalents (2) 79 13
Net change in cash and cash equivalents $ 1,382 $ (622) $ 360
Net Cash Provided by Operating
Activities
(In millions)
2009 2008
2007
Aflac Japan $ 5,177 $ 4,225 $ 3,573
Aflac U.S. and other operations 984 740 1,083
Total $ 6,161 $ 4,965 $ 4,656
Net Cash Used by Investing Activities
(In millions)
2009 2008
2007
Aflac Japan $ (5,156) $ (3,874) $ (3,231)
Aflac U.S. and other operations (320) (409) (423)
Total $ (5,476) $ (4,283) $ (3,654)
Aflac Annual Report for 2009 47